Digital SAT Problem-Solving and Data Analysis Decoded
The digital SAT problem solving data analysis domain carries the fewest questions of any Math domain, just 5 to 7 per section, yet it produces a disproportionate share of careless misses. The math sits at middle-school and early-algebra level, so students assume it is free points. That assumption is the trap: Problem-Solving and Data Analysis hides its difficulty inside tables, scatterplots, and statistics vocabulary, and a student who reads a graph axis wrong loses the point no matter how clean the arithmetic.
What Is Problem-Solving and Data Analysis?
Problem-Solving and Data Analysis, often shortened to PSDA, is the digital SAT Math domain that tests quantitative reasoning with real-world SAT math data: ratios, rates, proportional relationships, unit conversion, percentages, and statistics drawn from one-variable and two-variable data sets. According to College Board's domain page, it spans seven skill areas, from percentages to evaluating observational studies and experiments.
How Much Does PSDA Count?
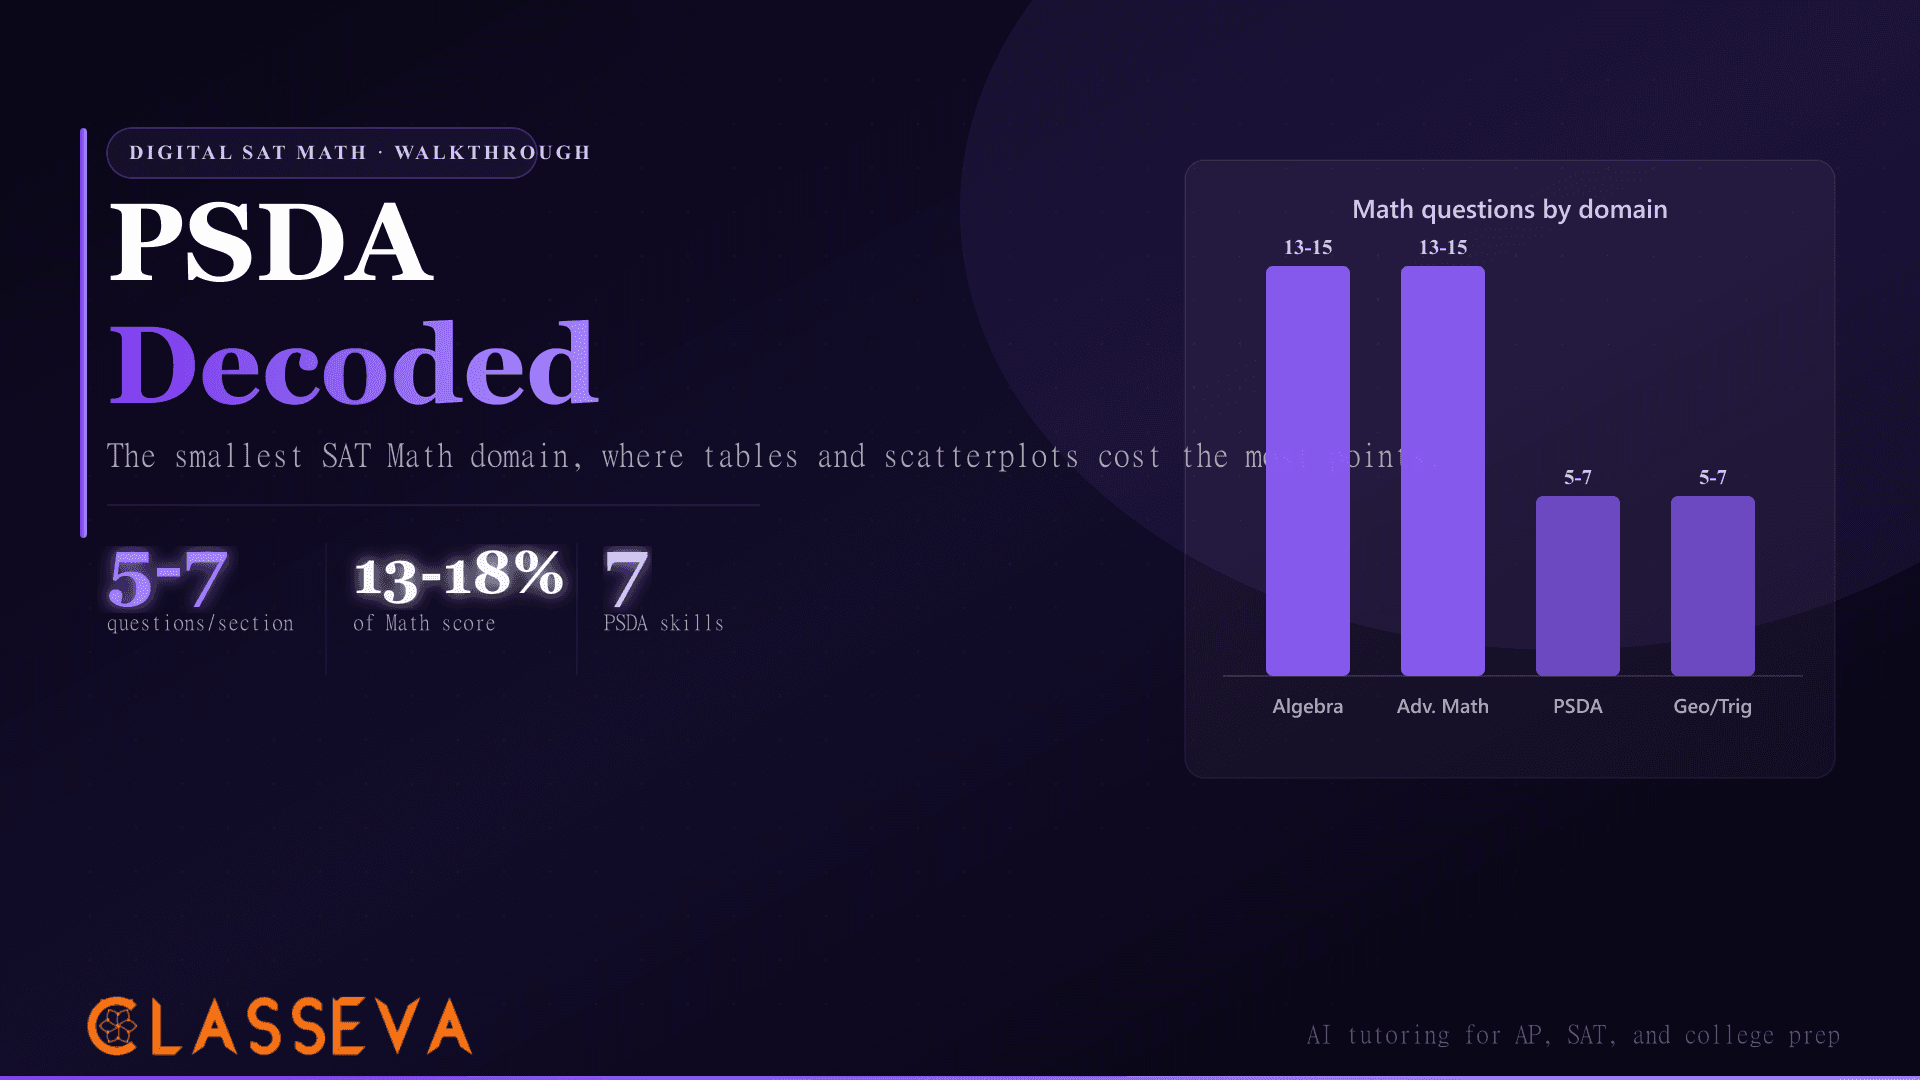
Each digital SAT Math section includes 5 to 7 PSDA questions out of 44 scored items, roughly 13 to 18 percent of your Math score. The College Board's Math section overview lists Algebra and Advanced Math at 13 to 15 questions each, with PSDA and Geometry/Trigonometry tied for last at 5 to 7. Small does not mean ignorable. Those 5 to 7 questions can swing your section score by 30 to 60 points on the 200 to 800 scale.
| Math Domain | Questions per Section | Approx. Share |
|---|---|---|
| Algebra | 13-15 | ~35% |
| Advanced Math | 13-15 | ~35% |
| Problem-Solving and Data Analysis | 5-7 | ~13-18% |
| Geometry and Trigonometry | 5-7 | ~13-18% |
Digital SAT Math domain weighting. Source: College Board Math section specifications.
Why the Smallest Domain Trips Students
The math content here is the easiest on the test. A typical PSDA question asks for a percent, a unit rate, or which data set has a larger spread. What raises the difficulty is the wrapper. Questions embed the numbers inside a two-way table, a dot plot, or a scatterplot, and the reading load climbs. Students who race through algebra slow to a crawl here, then misread an axis label or grab a row total when the question wanted a single cell.
Pulling the wrong number from a figure beats every calculation mistake combined. When a question shows a chart, read the prompt first, underline the exact quantity it wants (a single bar, one row, the conditional group), then return to the figure and take only that value. Reading the figure before the question is how students answer a different question than the one asked.
How Do You Solve SAT Ratio and Rate Questions?
Set up a proportion and keep units attached to every number. Most SAT ratio and rate questions give you one complete relationship and ask you to scale it. Write the known ratio as a fraction, set it equal to the unknown ratio with a variable, and cross-multiply. The single habit that prevents errors: label every numerator and denominator with its unit so you never divide miles by gallons when the answer wants gallons.
Worked Example: Proportional Relationship
A printer produces 3 pages every 8 seconds. At that rate, how many seconds does it take to print 51 pages? Set the rate equal: 3 pages over 8 seconds equals 51 pages over x seconds. Cross-multiply to get 3x equals 408, so x equals 136 seconds. The arithmetic is short. The discipline is writing the units so you do not flip the fraction and report 1.18 pages per second as the answer.
Unit Conversion Without Losing Track
Unit conversion questions chain ratios: convert minutes to seconds, then seconds to a rate. Treat each conversion factor as a fraction equal to 1, and cancel units diagonally. To convert 90 kilometers per hour into meters per second, multiply by 1000 meters per kilometer and by 1 hour per 3600 seconds; the kilometers and hours cancel, leaving 25 meters per second. Write the cancellation out. Mental shortcuts here cost more points than they save.
When a question buries two or three unit conversions in one sentence, line the factors up as fractions and cross out matching units before you multiply. If the units that remain match the answer choices, your setup is correct. If they do not, you flipped a factor. This check catches more errors than rechecking the arithmetic.
How Do SAT Percentage Questions Work?
SAT percentage questions test three moves: finding a percent of a number, finding what percent one number is of another, and computing percent change. The phrase that signals which move you need is small but decisive. "Percent of" means multiply; "what percent" means divide and convert; "percent increase or decrease" means take the difference over the original. Mislabeling the original value is the single most common error on percent change.
Worked Example: Percent Change
A laptop's price drops from $1,200 to $900. What is the percent decrease? Subtract to find the change: 1200 minus 900 equals 300. Divide by the original, not the new price: 300 over 1200 equals 0.25, so 25 percent. Students who divide by 900 get 33 percent and pick a wrong answer the test deliberately offers. The original value always sits in the denominator for percent change.
| Question Phrasing | Operation | Quick Example |
|---|---|---|
| "What is 30% of 80?" | Multiply: 0.30 × 80 | 24 |
| "45 is what percent of 60?" | Divide: 45 ÷ 60 | 75% |
| "Increase from 50 to 65" | Change ÷ original: 15 ÷ 50 | 30% increase |
| "Decrease from 1200 to 900" | Change ÷ original: 300 ÷ 1200 | 25% decrease |
The three percentage operations the SAT tests, with the phrasing that signals each.
Compound percent change shows up in the harder Module 2. A value that rises 20 percent then falls 20 percent does not return to its start; it lands at 96 percent of the original because the second percent applies to a larger base. Multiply the factors (1.20 then 0.80) rather than adding and subtracting the percents. For broader context on which math topics carry the most weight, the digital SAT Math algebra subsection guide and the advanced math subsection guide cover the two domains that together make up about 70 percent of your Math score.
What Statistics Does the SAT Test?
The SAT tests descriptive statistics, not inferential computation: mean, median, mode, range, and a conceptual grasp of standard deviation. You will never calculate standard deviation by hand. Instead, questions ask which of two data sets has greater spread, or how adding a value shifts the mean and median. The College Board's content domain documentation groups these under one-variable data: distributions and measures of center and spread.
Mean, Median, and Spread
The gap between mean and median is the SAT's favorite statistics trick. In a symmetric data set they match. Add one large outlier and the mean jumps toward it while the median barely moves. A question might show salaries where one executive earns ten times the median worker; the test wants you to know the median describes the typical worker better than the mean. Recognize skew on sight and you answer these in under 30 seconds.
Standard deviation measures how far values sit from the mean on average. The SAT compares two data sets and asks which has the larger standard deviation. The answer is the set whose values spread wider from their center, regardless of where that center sits. A tightly clustered set near 100 has a smaller standard deviation than a scattered set, even if both share the same mean.
How Are Probability Questions Structured?
SAT probability questions almost always read from a two-way table. The structure is consistent: a table splits a population by two categories, and the question asks for a probability restricted to one row, one column, or one cell. The skill is identifying the correct denominator. A plain probability uses the grand total; a conditional probability ("given that the person is left-handed") uses only that subgroup's total.
Consider a table of 200 students split by grade and whether they play a sport. If 60 of the 90 juniors play a sport, the probability that a randomly chosen junior plays a sport is 60 over 90, which reduces to two-thirds. The trap answer divides by 200, the grand total, treating a conditional question as an unconditional one. The phrase "given that" or "among the" is your signal to shrink the denominator.
How Do You Read SAT Tables and Graphs?
Read the question, then the axis labels, then the data, in that order. SAT data interpretation questions pair a figure (bar chart, scatterplot, line graph, or two-way table) with a prompt that targets one specific value or trend. The figure carries more information than the question needs, and the extra data is there to slow you down. Pull only what the prompt names.
Scatterplots and Lines of Best Fit
Scatterplots add a line of best fit and ask you to predict, interpret slope, or spot the point that deviates most. Slope answers "how much does y change per unit of x," so read it with units: a slope of 2.5 on a height-versus-age plot means 2.5 centimeters per year. Prediction questions want the y-value on the line at a given x, not the nearest data point. The line, not the dots, drives the answer.
Two-way tables deserve a final word. They look simple, four numbers in a grid, yet they generate more conditional-probability errors than any other figure. Mark which margin the question wants before you compute. The digital SAT adaptive structure explainer shows why a clean run through Module 1 routes you to an easier Module 2, which makes accuracy on these readable PSDA questions worth more than raw speed.
How Does Desmos Verify Data Answers?
Desmos confirms PSDA answers in seconds because it computes statistics and regressions directly from a table. Bluebook ships Desmos on every Math question, so a data set you would otherwise average by hand becomes a one-line check. Type the values into a Desmos table, and the mean, median, and a line of best fit are a command away. This turns a verification habit into a built-in safety net.
Regression for Line-of-Best-Fit Problems
For a scatterplot prediction, enter the data as a table in Desmos, then type a regression line such as y1 ~ m*x1 + b. Desmos returns the slope m and intercept b instantly, and you read the prediction by plugging in the x-value. No mental estimation of the line, no eyeballing the slope. For the eight or so questions where this applies, the full Desmos strategy walkthrough shows the table, slider, and regression workflows step by step.
For sat statistics questions, put a small data set in a Desmos table column, then use the mean and median functions on that column to confirm your arithmetic. When a question asks how an added value shifts the mean, compute both versions in Desmos side by side. The whole check costs under 20 seconds and catches the off-by-one and dropped-value errors that hand calculation invites.
Desmos does not read the question for you. It cannot tell whether you want a conditional probability or a percent change, and it will happily compute the wrong statistic on the wrong subset. Use it to verify a setup you already understand, not to skip the reading. Pair it with a deliberate practice routine, and the digital SAT test day walkthrough shows how to fold Desmos checks into your pacing without losing time.
How Should You Study PSDA?
Drill by pattern, not by random mixed sets. The PSDA domain reduces to five repeating shapes: ratios and units, percentages, center and spread, probability from tables, and data interpretation. Work 10 to 15 questions of one pattern in a row until you name it on sight and reach for the right setup automatically. Then mix patterns to rebuild the recognition speed the real test demands.
Inefficient PSDA Study
- •Random mixed problem sets from day one
- •Re-reading explanations without redoing the problem
- •Skipping figure-heavy questions because they feel slow
- •Ignoring Desmos until test week
- •Memorizing standard deviation formulas you never use
Efficient PSDA Study
- •Block practice: 10-15 questions per pattern, then mix
- •Redo every missed question from scratch a day later
- •Drill two-way tables and scatterplots most, since they cost the most points
- •Practice Desmos checks at desmos.com/testing weekly
- •Learn what each statistic means, not how to compute it by hand
Block practice followed by interleaving rests on solid learning-science ground. Bjork's research on the spacing and interleaving effects shows that mixing problem types after initial blocked practice builds the on-sight recognition the timed SAT rewards. The first phase teaches the pattern; the second phase teaches retrieval under variety. The interleaving study technique guide and the active recall versus passive review breakdown translate that research into a weekly PSDA routine.
If you are weighing whether to keep focusing on the SAT or pivot toward the ACT, the section structures reward different strengths. Compare your projected scores with the SAT-ACT Converter below, then read the digital SAT versus enhanced ACT comparison to decide which test fits your data-reading speed.
SAT-ACT Converter
Convert a digital SAT score to its ACT composite equivalent to compare your standing on both tests and decide where your data-analysis strengths pay off most.
Key Takeaways
- PSDA is the smallest digital SAT Math domain by weight. Each section carries 5 to 7 of these questions, roughly 13 to 18 percent of the 44 scored Math items, tied with Geometry and Trigonometry for last place.
- The math is easy; the figures are the trap. Tables, scatterplots, and two-way grids cause more errors than calculation. Read the question before the figure, then pull only the value the prompt names.
- Percent change always divides by the original value. The new value never sits in the denominator, and the SAT offers the wrong-denominator answer on purpose.
- The mean chases outliers; the median resists them. Recognize skew on sight and answer center-of-distribution questions in under 30 seconds.
- Probability questions hinge on the denominator. Unconditional uses the grand total; conditional ("given that," "among the") shrinks to one subgroup.
- Desmos verifies data answers fast. Paste a data set into a table, run a regression for line-of-best-fit, and confirm mean or slope before you commit to an answer.
- Study by pattern, then interleave. Block-practice one of the five PSDA shapes until automatic, then mix to rebuild recognition speed for the timed exam.