Digital SAT Math: How to Use Desmos to Save 15 Minutes
Building Classeva's SAT math tools, I tracked how students actually used Desmos during practice tests. The pattern was consistent: almost everyone typed an equation into the function bar, looked at a graph, and moved on. Almost no one clicked intersection points, used sliders, or ran a regression. The students who did those things scored 50-80 points higher on the math section than their earlier practice scores predicted. The tool was identical. The technique was entirely different.
The digital SAT provides Desmos on every Math question through Bluebook. Most test prep content notes this fact and moves on. This post treats Desmos as what it actually is: a strategy that bypasses algebra entirely on specific question types. Each of the eight techniques below includes a worked example with the exact steps, not just the concept.
What Is Desmos on the Digital SAT?
Desmos is a full graphing calculator that runs natively inside the Bluebook app on every Math question in both Module 1 and Module 2. It opens with a single click in the left panel of the Math interface. Students do not need to install anything or bring a separate device. The testing-specific version of Desmos, available for free practice at desmos.com/testing, replicates exactly what appears during the exam.
How Desmos Compares to a Standard Calculator
The TI-84 and similar graphing calculators can graph the same functions as Desmos, but the workflow differs substantially. Desmos renders graphs in real time as you type. Clicking an intersection point, a zero, or a vertex returns the exact labeled coordinates instantly. The TI-84 requires navigating the CALC menu, selecting the appropriate operation, and manually positioning a cursor near the point of interest.
Standard Graphing Calculator (TI-84)
- •Enter function, press GRAPH, adjust window manually
- •Intersection: use 2nd CALC menu, position two cursors
- •Zeros: use 2nd CALC ZERO, set left and right bounds manually
- •Vertex: use 2nd CALC MINIMUM or MAXIMUM with bounds
- •No regression shortcut; requires STAT CALC LinReg
- •Small pixel display, limited real-time feedback
Desmos (Built into Bluebook)
- •Renders instantly as you type each expression
- •Click any intersection point to get labeled coordinates
- •Click x-intercepts for exact zero values immediately
- •Click vertex for exact coordinates without menu navigation
- •Regression via y1 ~ mx1 + b in one expression line
- •Full-screen, zoomable, smooth real-time updates
Getting Familiar With Desmos Before Test Day
Practice specifically at desmos.com/testing before any full practice test. Spend 30 minutes on these four actions until each takes under 10 seconds: type a function and click an intersection point, type a variable letter to create a slider, click the table icon on an expression to open table view, and type “y1 ~ mx1 + b” to run a regression. Speed with these features under time pressure determines whether Desmos actually saves time on test day.
Open desmos.com/testing and graph “y = 2x + 1” and “y = -x + 4”. Click the intersection point. If the labeled coordinates appear in under 5 seconds, you are ready to use systems graphing on the SAT. If not, spend 10 minutes on this one action before moving on.
Technique 1: Solving Systems of Equations
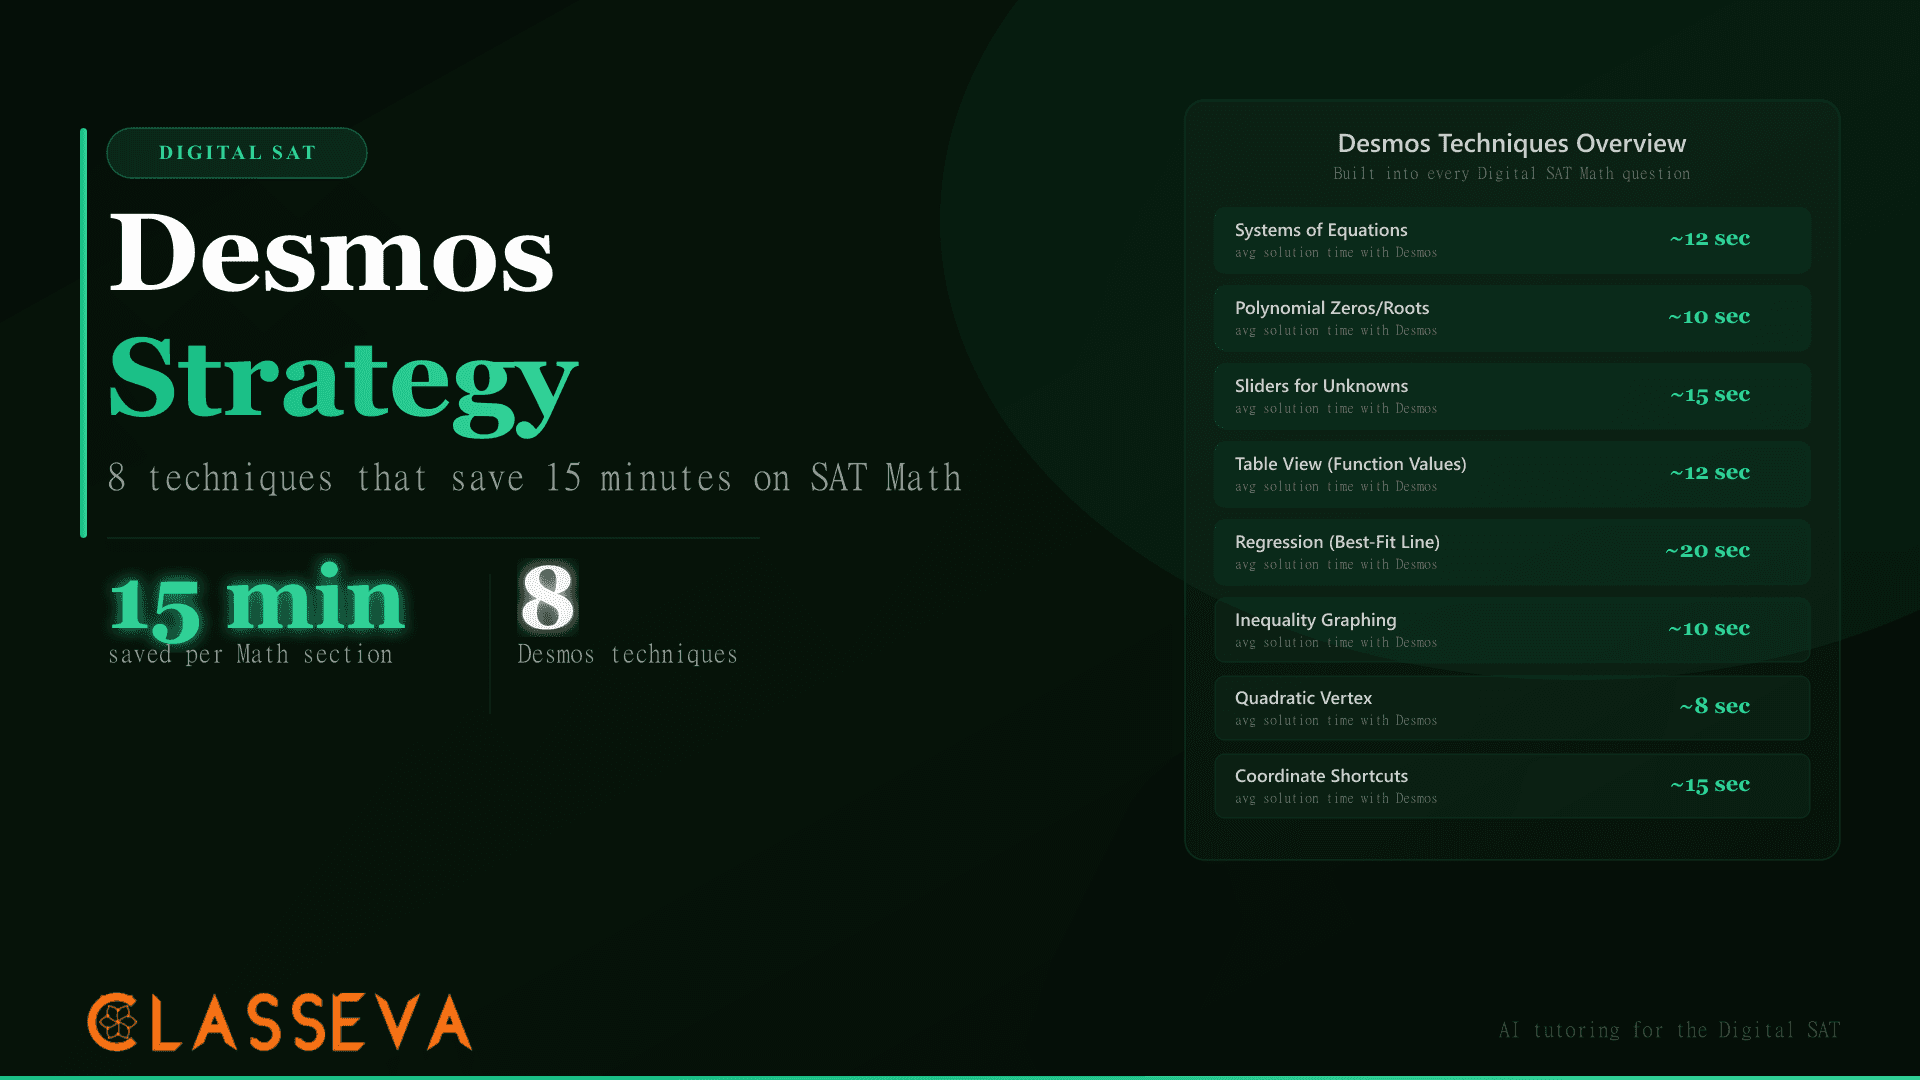
Graphing two lines and clicking their intersection returns both x and y immediately. No algebra. The SAT tests systems of equations regularly, and algebraic solving (substitution or elimination) takes 60-90 seconds when the coefficients are messy. Desmos takes 12 seconds on any system.
Step-by-Step Workflow
Example problem: “Solve the system y = 2x + 1 and y = −x + 4. Find x + y.”
Type the first equation
Enter "y = 2x + 1" in expression line 1. A line appears on the graph instantly.
Type the second equation
Enter "y = -x + 4" in expression line 2. A second line appears in a different color.
Click the intersection point
Two lines cross on the graph. Click exactly on the crossing point. Desmos labels it with the exact coordinates.
Read the answer
Desmos labels the intersection (1, 3). So x = 1 and y = 3. The question asks x + y = 4.
Algebraically, this requires setting 2x + 1 = −x + 4, solving 3x = 3 to get x = 1, then substituting back for y = 3. That runs 60-90 seconds for most students. The Desmos method runs about 12 seconds. On a system with fractions or decimals, the algebraic path is more error-prone and slower; the Desmos method takes the same 12 seconds regardless of coefficient complexity.
Do not estimate visually where lines cross. Zoom in and click the exact intersection point. Desmos shows precise coordinates, not approximations. Visual estimation can place the intersection at (1.1, 3.2) when the true answer is (1, 3), costing a point.
Technique 2: Finding Zeros and Roots of Polynomials
When the SAT asks for x-intercepts, roots, or zeros of a polynomial, type it as y = f(x) in Desmos and click each x-intercept. Desmos labels exact coordinates.
Example: “f(x) = x² − 5x + 6. What is the sum of all real zeros?” Type “y = x^2 - 5x + 6” in Desmos. Click the two x-intercepts. Desmos labels them (2, 0) and (3, 0). Sum of zeros = 5. Factoring this polynomial algebraically takes 30-45 seconds for most students. Desmos returns both roots in under 10 seconds.
This technique extends to cubic and higher-degree polynomials that would require complex factoring or grouping. Type any polynomial and click each x-intercept for immediate exact values. The SAT occasionally asks about polynomials with irrational roots; Desmos displays these as decimals, which you can compare directly to answer choices.
On the SAT, “roots,” “zeros,” and “x-intercepts” refer to the same mathematical objects: the values of x where f(x) = 0. All three terms prompt the same Desmos action (graph the function, click x-intercepts).
Technique 3: Using Sliders for Unknown Coefficients
Sliders are Desmos's most underused feature on the SAT. When you type any letter other than x or y into a Desmos expression, a slider for that variable appears automatically. Drag the slider and the function updates in real time.
Example: “The graph of y = ax + 3 passes through (4, 11). Find the value of a.”
Type the function with the unknown coefficient
Enter "y = ax + 3" in expression line 1. A slider labeled "a" appears below the expression automatically.
Plot the target point
Type "(4, 11)" in expression line 2. A point appears on the graph at those coordinates.
Drag the slider until the line hits the point
Move the "a" slider left or right. The line rotates around its y-intercept. Watch for the line to pass through (4, 11).
Read the slider value
When the line passes exactly through (4, 11), read the slider value. Here, a = 2. That is your answer.
When Parametric Problems Show Up
Parametric SAT questions ask things like “for how many values of k does the system have exactly one solution?” or “which value of b makes the two lines parallel?” Setting up a discriminant inequality or solving for slope equality algebraically takes 2-3 minutes on these. With sliders, graph both conditions, then drag the parameter until the graph shows the asked-for geometric relationship (one intersection, parallel lines, etc.) and read the slider value.
Technique 4: Table View for Function Value Problems
Desmos's table view accepts multiple x-values and returns corresponding y-values for any function you have typed. Find it by clicking the table icon (a small grid symbol) that appears on any expression row.
Example: “f(x) = 3x² − 2x. Find f(5) + f(−2).” Type “f(x) = 3x^2 - 2x” in Desmos. Click the table icon. Enter x = 5 and x = −2 in the x-column. Desmos shows y = 65 and y = 16 immediately. Sum = 81. Manual substitution takes 35-40 seconds. Table view takes about 12 seconds.
Table view also helps with sequence problems. Define a recursive function in Desmos, enter the first several n-values in the table, and Desmos returns each term of the sequence without you calculating each one by hand.
Technique 5: Regression for Line-of-Best-Fit Problems
The Digital SAT Math section includes scatter plot questions where you are given data points and asked about the slope, y-intercept, or equation of the line of best fit. Desmos automates this through its regression mode.
Running Regression in Desmos
Add a table
Click the "+" icon in the expression sidebar and select Table. Two columns appear: x1 and y1.
Enter the data points
Type each (x, y) pair from the problem into the table rows. Desmos plots each point on the graph as you enter it.
Write the regression formula
In a new expression line below the table, type: y1 ~ mx1 + b (using the tilde ~ instead of equals =). The tilde tells Desmos to find the best-fit line.
Read the results
Desmos displays the values of m (slope) and b (y-intercept) in the sidebar, and draws the regression line on the graph.
To type x₁ and y₁ in Desmos, type x_1 and y_1 using an underscore. Desmos converts these to subscript automatically. The tilde (~) in the regression formula is the key: it signals “find the best-fit parameters” rather than graphing a specific equation.
The SAT consistently uses clean data that produces integer or simple decimal results. If your regression returns m = 1.5 and the answer choices include 1.5, 1.8, and 2.0, you have your answer without any calculation.
Technique 6: Inequality Graphing for Solution Regions
The SAT tests systems of inequalities by asking which specific (x, y) point satisfies both conditions, or how many integer points fall within a solution region. Desmos shades the feasible region automatically when you type an inequality using > or < instead of =.
Type “y > 2x − 3” in line 1 and “y < −x + 5” in line 2. Desmos shades the overlapping region. For multiple-choice questions with specific point options, type each candidate point as a separate expression and confirm visually whether it falls inside the shaded region. This replaces 60 seconds of substituting two or three answer choices into both inequalities by hand.
Technique 7: Quadratic Vertex Without Completing the Square
Completing the square converts f(x) = ax² + bx + c to vertex form, revealing the vertex coordinates. For most students, this takes 2-3 minutes and carries arithmetic error risk. Desmos returns the vertex by click.
Example: “What is the minimum value of f(x) = x² − 6x + 11?” Type “y = x^2 - 6x + 11” in Desmos. The parabola appears. Click the lowest point. Desmos labels it (3, 2). The minimum value is 2.
How to Read the Vertex From the Graph
After graphing, scroll to locate the vertex. Click on it precisely. Desmos labels the point with exact coordinates, including fractions when the vertex is not at an integer. For a downward-opening parabola (negative leading coefficient), click the highest point on the curve for the maximum value instead of the minimum.
Technique 8: Coordinate Geometry Shortcuts
SAT coordinate geometry questions ask for slope, distance, or midpoint between two given points. These formulas are short but arithmetic-heavy. Desmos removes the arithmetic.
Type both points as (x₁, y₁) and (x₂, y₂) in Desmos (using x_1, y_1 notation). For slope, type the slope formula as a separate expression: “m = (y_2 - y_1) / (x_2 - x_1)”. Desmos evaluates it instantly and displays the numerical value. For midpoint, type “((x_1 + x_2)/2, (y_1 + y_2)/2)” and Desmos plots the midpoint on the graph and labels its coordinates.
This saves 20-30 seconds per question and eliminates the sign errors that appear when students subtract negative coordinates manually.
When Does Desmos NOT Help?
Reaching for Desmos on the wrong question type wastes 15-20 seconds. Recognize these question types within the first 10 seconds of reading to skip Desmos entirely.
| Question Type | Use Desmos? | Why |
|---|---|---|
| Systems of equations | Yes | Graph and click intersection: ~12 seconds |
| Polynomial roots / zeros | Yes | Graph and click x-intercepts: ~10 seconds |
| Quadratic vertex / min / max | Yes | Graph and click vertex: ~8 seconds |
| Line-of-best-fit / regression | Yes | Table + y1 ~ mx1 + b formula: ~20 seconds |
| Inequality solution regions | Yes | Type inequality, region shades automatically |
| Unknown coefficient problems | Yes | Slider technique (see Technique 3 above) |
| Angle relationships / triangles | No | Geometric reasoning, not graphing |
| Circle theorems / arc length | No | Requires formula-based geometric reasoning |
| Trigonometric identities | No | Algebraic proof, graph does not help |
| Word problems (setup required) | No | Translating words to equation is the tested skill |
Use Desmos on question types involving graphing; skip it on pure geometry and proof-based questions.
Before opening Desmos, ask yourself: can I graph what this question is asking about? If yes and the relevant function or equation is clear, open Desmos. If the question involves angles, triangles, or logical deduction without a graphable relationship, solve directly.
How Much Time Can Desmos Realistically Save?
The Math section of the Digital SAT runs 44 questions across two 35-minute modules, averaging about 95 seconds per question. On 8-10 questions per module where a Desmos technique applies, solution time drops from 60-90 seconds to 8-20 seconds. That frees roughly 10-15 minutes across the full Math section.
That recovered time is not theoretical downtime. Harder questions in Module 2 reward every additional second. Students with 10 extra minutes can revisit flagged questions, recheck substitution arithmetic, and read each answer choice more carefully. These are the habits that convert a 1350 into a 1420.
According to College Board's Bluebook documentation, Desmos is available throughout the entire Math section as a native tool. Students who use it systematically on applicable questions consistently outperform students who treat it as a backup option or ignore it entirely.
To turn Desmos efficiency gains into an actual score target, use the Test Score Goal Setter below. Enter your current math practice score and your goal score to see how many additional correct answers you need and where the biggest gains come from.
Test Score Goal Setter
Enter your current SAT Math practice score and your target score. The calculator shows how many additional correct answers you need and how Desmos-style time savings translate to score improvement.
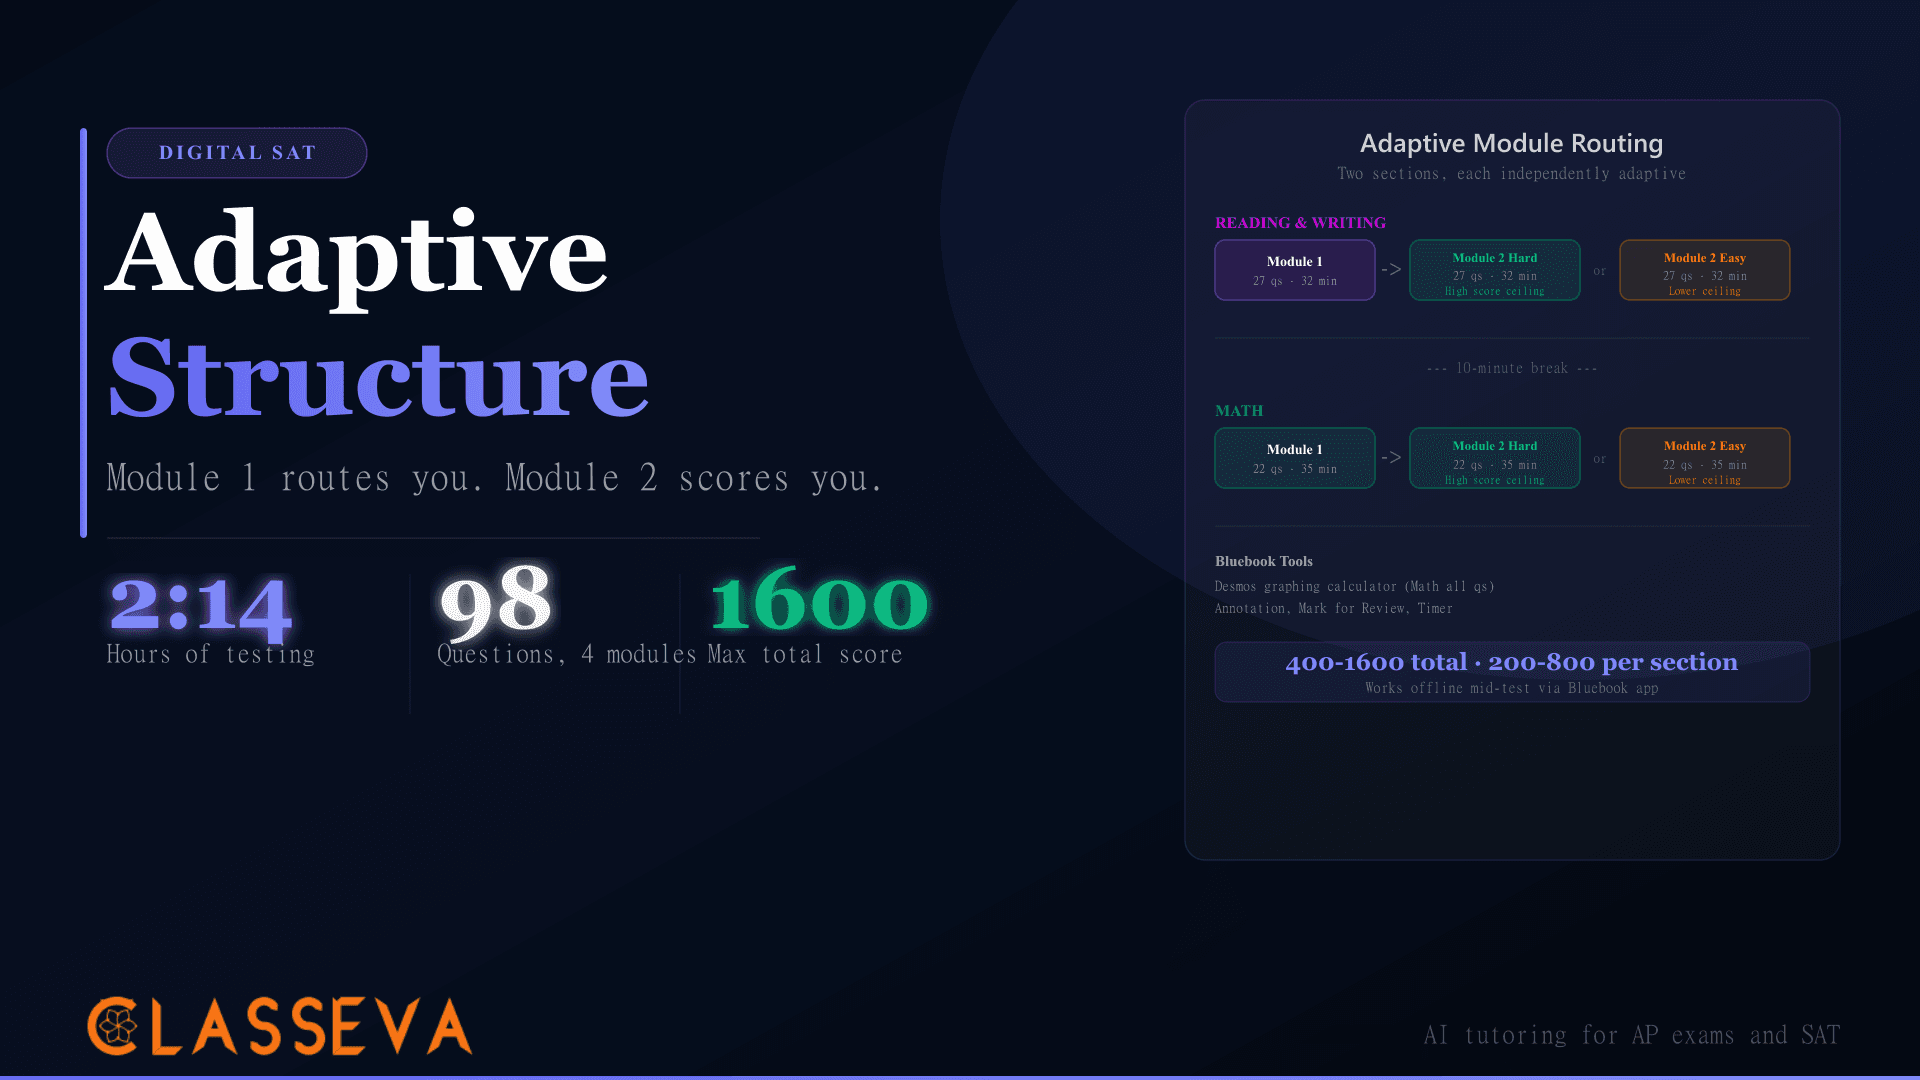
For a full breakdown of the Digital SAT's adaptive structure and how Module 1 performance determines your Module 2 difficulty band, read the Digital SAT adaptive structure guide. Understanding the routing system changes how aggressively you should prioritize Module 1 accuracy alongside Desmos speed.
If you are comparing the SAT and ACT and wondering which test suits your math strengths better, the SAT-ACT Convertermaps your current scores between the two exams. The ACT does not include Desmos, so the Digital SAT's built-in graphing tools can be a meaningful strategic advantage for the right student.
Key Takeaways
- Desmos runs natively in Bluebook on every Digital SAT Math question in both modules, with no physical calculator required.
- Systems of equations, polynomial roots, and quadratic vertex problems resolve in 8-15 seconds via Desmos, versus 60-90 seconds algebraically.
- The slider feature solves parametric coefficient problems without setting up discriminant equations or solving algebraically for the parameter.
- Table view evaluates any function at multiple x-values simultaneously, replacing manual substitution for function value and sequence problems.
- Regression mode (y1 ~ mx1 + b) automates line-of-best-fit problems from raw data points in under 20 seconds.
- Inequality graphing shades solution regions, converting substitution-heavy multiple-choice answer-checking into a visual two-second task.
- Desmos does not help on geometry theorems, trigonometric proofs, or problems where constructing the equation is the tested skill. Recognize these question types within 10 seconds to avoid wasting time.
See the full Digital SAT resource library at the SAT resources hub for section guides, practice test links, and pacing strategy. The Optimal Test Date Selector can help you plan when to take the SAT to maximize your preparation window.