PSAT/NMSQT 2026: How the National Merit Path Actually Works
The National Merit Scholarship Corporation distributes roughly $28 million in scholarships each year to approximately 7,500 seniors. The path to that money starts with a single 2-hour test taken in October of junior year. The first time I dug into the NMSC's published program guide, the detail that struck me as genuinely underreported was the state-by-state cutoff table: a student scoring a Selection Index of 217 might be a Semifinalist in Wyoming and miss the threshold entirely in California, where the cutoff approaches 222. That 15-point variation reflects population density, not academic ability. Understanding which bucket you are in before October of junior year separates targeted preparation from hoping for the best.
What Is the PSAT/NMSQT and When Do Students Take It?
The PSAT/NMSQT stands for Preliminary SAT / National Merit Scholarship Qualifying Test. It does two things at once: measures readiness for the SAT and qualifies students for recognition in the National Merit Scholarship Program. Both functions run on the same test, same score report, same morning.
The October Test Window
College Board administers the PSAT/NMSQT nationally during a window of approved October dates. Students register through their high school, not through College Board directly. Most schools auto-register all enrolled juniors; others require students to opt in. The fee runs approximately $18, though many schools waive it.
Sophomores can also take the PSAT/NMSQT, but sophomore scores do not count for National Merit eligibility. Only the score from the October of 11th grade qualifies. There is no retake option: you get one shot per year, and only the junior-year administration counts for the National Merit program.
What the PSAT and SAT Share (and How They Differ)
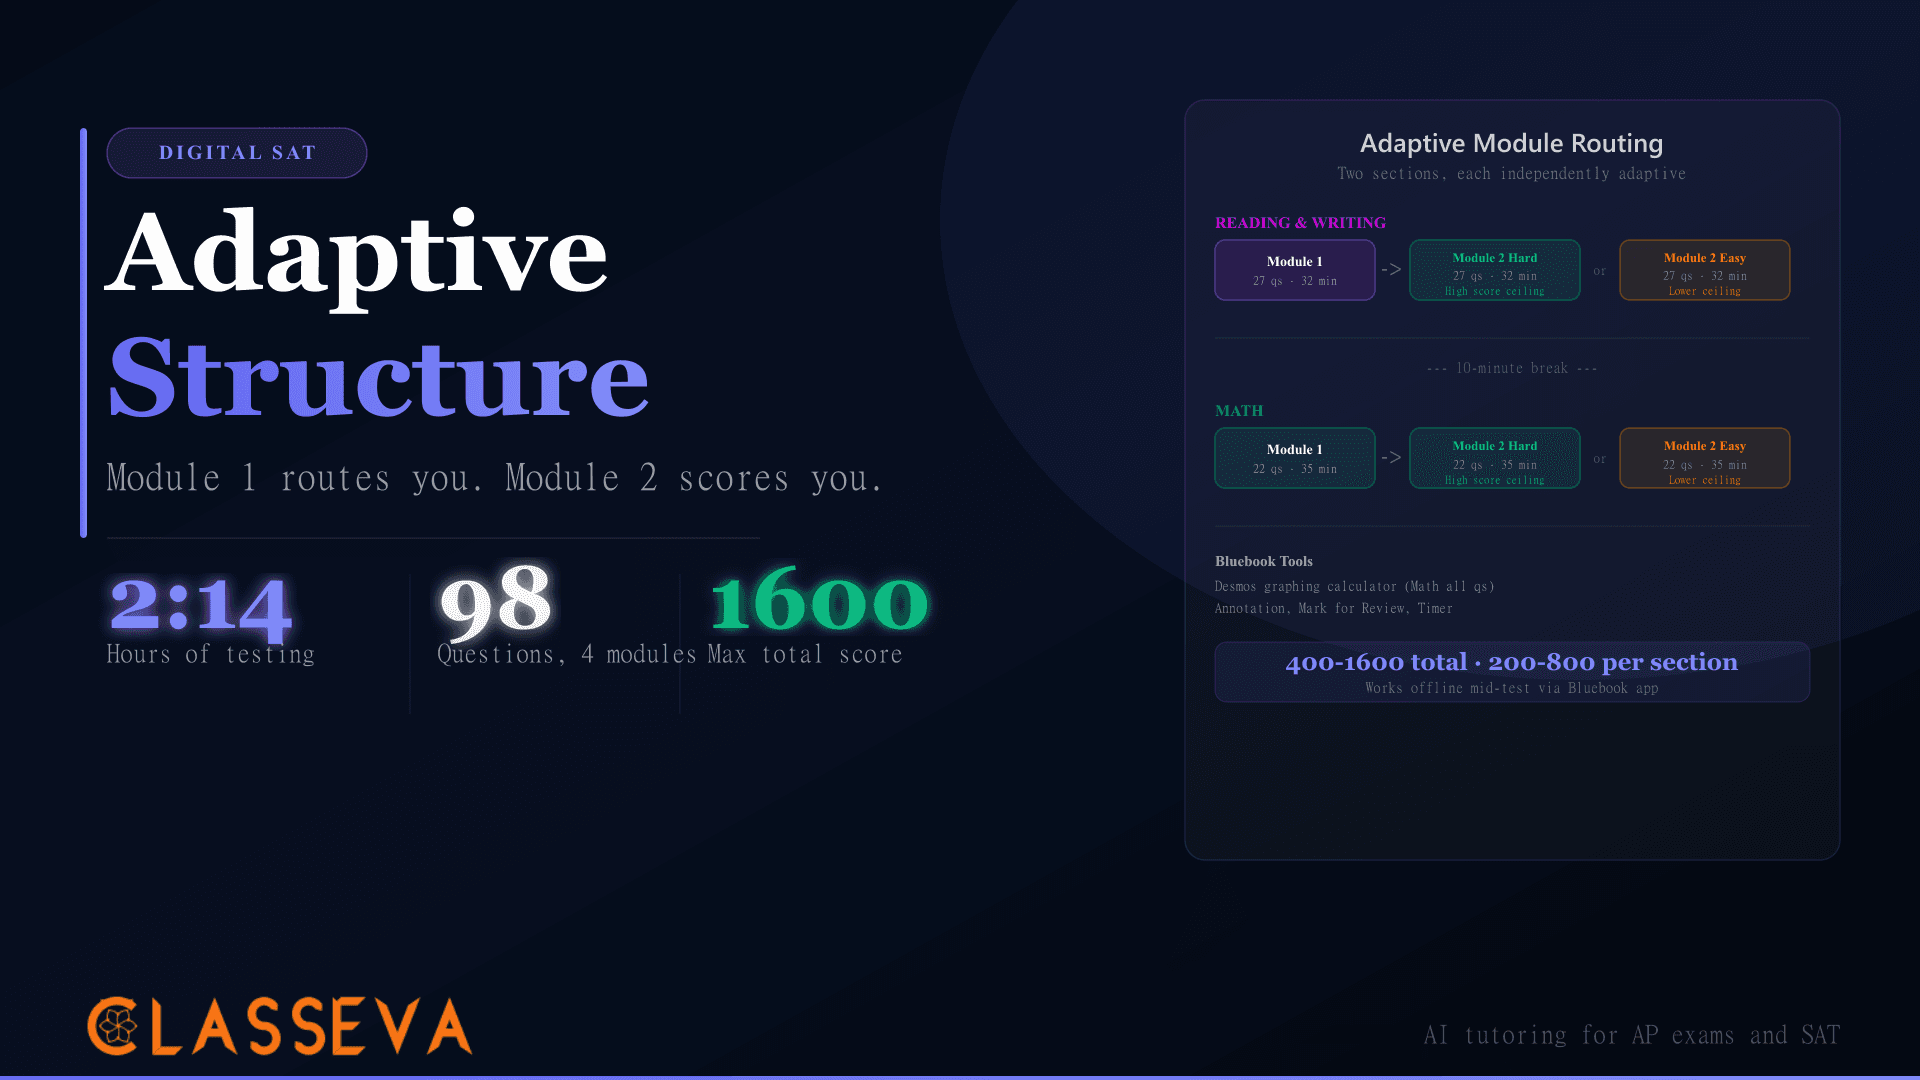
Since College Board redesigned both tests in 2023, the PSAT/NMSQT and the Digital SAT share the same adaptive module structure. Both run in Bluebook, both split each section into two adaptive modules, and both test Reading and Writing alongside Math. The mechanics of how Module 1 routes to harder or easier Module 2 apply on the PSAT exactly as on the SAT.
PSAT/NMSQT
- •Taken in October of 11th grade
- •Scores 320-1520 (sections: 160-760 each)
- •Qualifies for National Merit recognition
- •Not submitted to colleges for admissions
- •Administered at your high school
- •Selection Index determines NMSC eligibility
Digital SAT
- •Taken on student-chosen dates year-round
- •Scores 400-1600 (sections: 200-800 each)
- •Primary college admissions score
- •Sent to colleges via Score Choice
- •Administered at College Board test centers
- •Confirmatory SAT required for NM Finalists
How Is the PSAT Scored Differently From the SAT?
The PSAT/NMSQT scores 320-1520 total, compared to the SAT's 400-1600. Each section (Reading and Writing; Math) scores 160-760 on the PSAT versus 200-800 on the SAT. The narrower range reflects that the test targets junior-year ability rather than the full college-readiness spectrum the SAT covers.
The 320-1520 Score Scale
| PSAT/NMSQT | Digital SAT | |
|---|---|---|
| Total score range | 320-1520 | 400-1600 |
| Reading and Writing section | 160-760 | 200-800 |
| Math section | 160-760 | 200-800 |
| Total questions | 98 | 98 |
| Total testing time | ~2 hr 14 min | ~2 hr 14 min |
| Used for college admissions? | No | Yes |
| Determines National Merit? | Yes (juniors only) | No |
Source: College Board PSAT/NMSQT and SAT documentation
The question count and testing time match the Digital SAT exactly. What changes is the scoring scale and purpose. Because the PSAT targets a slightly lower difficulty ceiling than the SAT, perfect performance produces a 1520, not a 1600.
The Selection Index: The Number That Drives National Merit
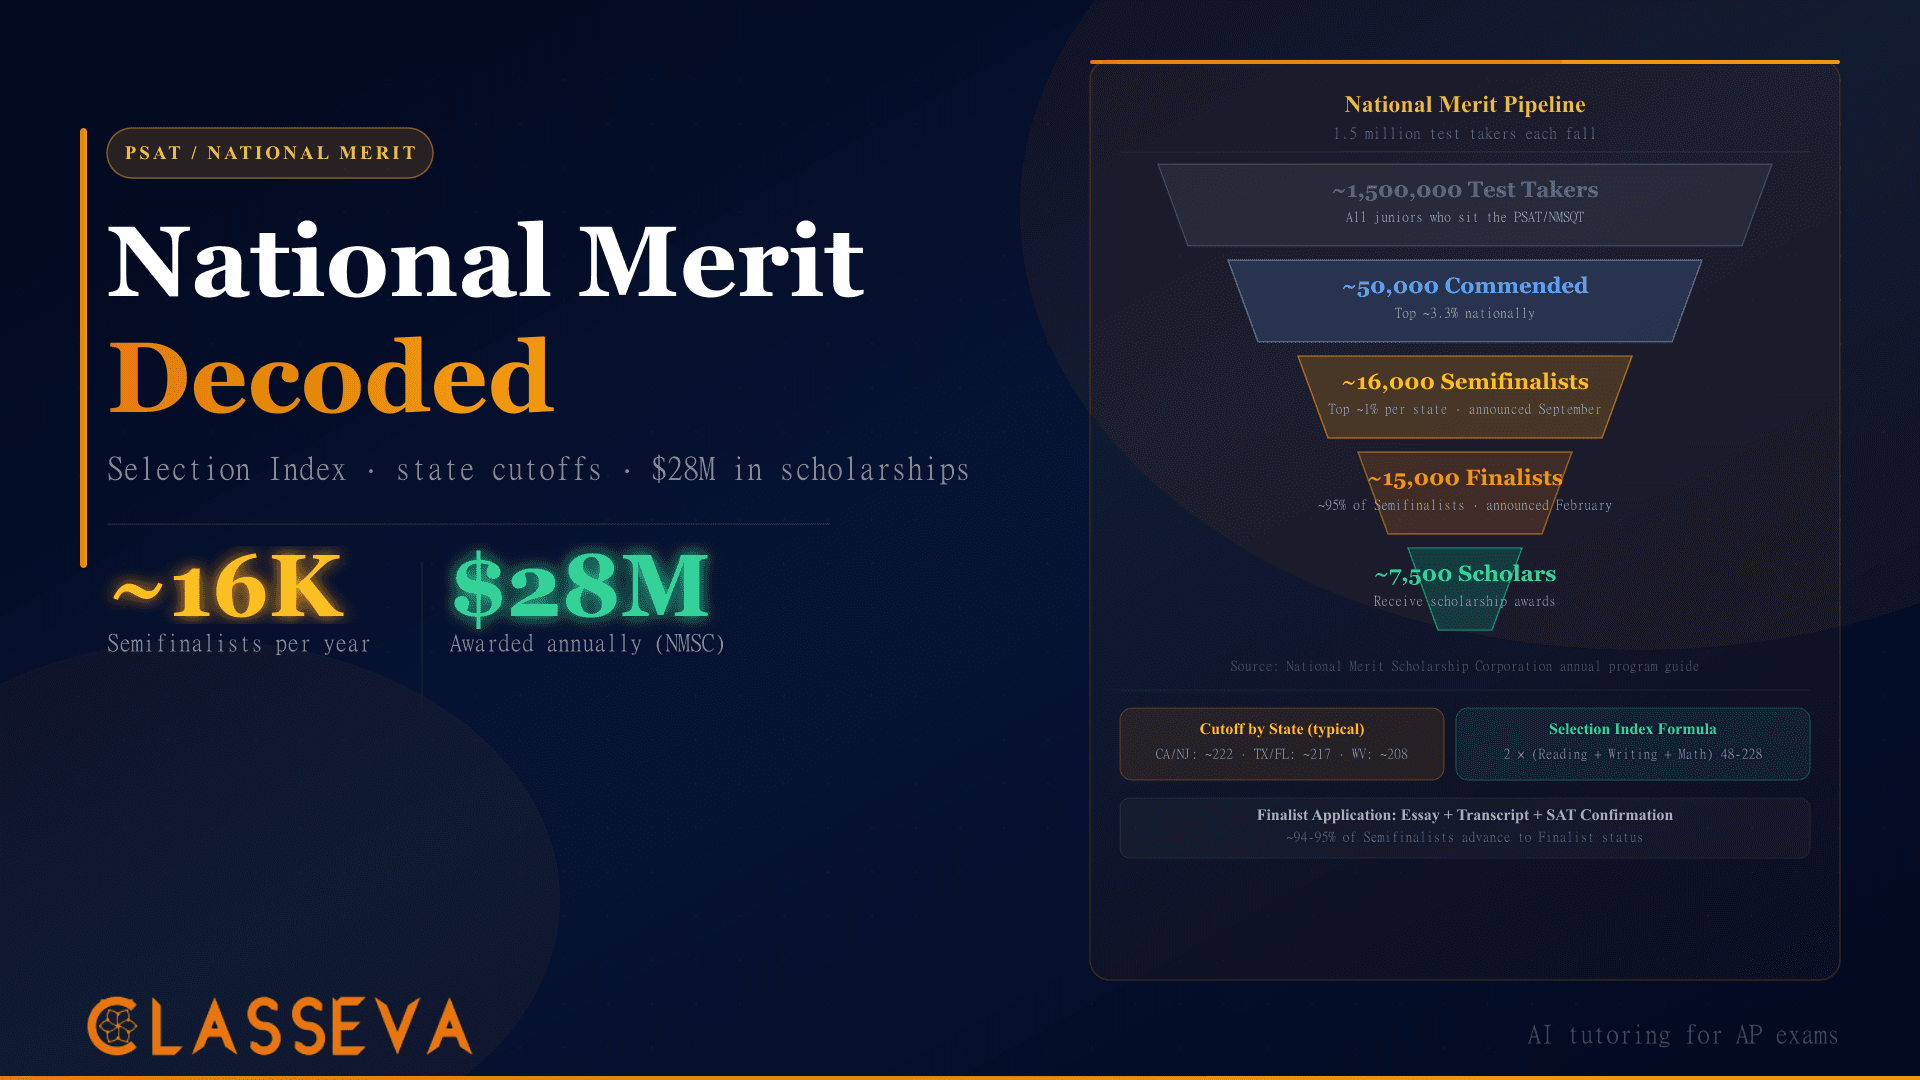
Your total PSAT score does not determine National Merit eligibility. The Selection Index does. This composite is calculated from three area scores reported within your PSAT score report: Reading (8-38), Writing and Language (8-38), and Math (8-38). The formula: Selection Index = 2 × (Reading + Writing/Language + Math), which ranges from 48 at the minimum to 228 at the perfect score.
A student with a 1400 total PSAT could have different Selection Indices depending on how the score breaks across the three areas. Because the formula weights all three components equally, weakness in Writing/Language costs as much as weakness in Math.
Your PSAT total score and your Selection Index are not the same thing. A student with a 1480 total might have a lower Selection Index than a student with a 1460 if their area scores distribute differently. Run the formula yourself using the area scores on your score report, not the section scores.
What Is the National Merit Pipeline?
Roughly 1.5 million juniors take the PSAT/NMSQT each year. The National Merit program filters that cohort through four recognition tiers, ending with approximately 7,500 scholarship recipients. The funnel is steep at every stage.
From Commended to Semifinalist: The Numbers
The top ~3.3% of PSAT/NMSQT scorers (roughly 50,000 students) receive Commended Student recognition. This letter acknowledges strong performance but does not lead directly to scholarship awards. Commended status does not advance to Finalist consideration.
The remaining ~16,000 highest scorers become Semifinalists. This group represents slightly above 1% of all test takers. Semifinalists receive their designation in September of senior year through their high school, not directly from the NMSC. The Semifinalist letter is the first step toward scholarship competition.
Semifinalist Cutoffs: Why Your State Matters
The NMSC allocates Semifinalist slots proportionally to each state's share of graduating high school seniors. States with larger, more academically concentrated student populations receive more Semifinalist slots in absolute terms, but the cutoff rises because more high-scoring students compete for those slots. California, New Jersey, Massachusetts, and Washington DC consistently post the highest cutoffs, typically 220-222. West Virginia, North Dakota, and Mississippi typically see cutoffs in the 207-211 range.
| State | Typical SI Cutoff Range | Relative Competition |
|---|---|---|
| California | 221-222 | Highest |
| New Jersey | 220-222 | Highest |
| Massachusetts | 220-221 | Highest |
| Washington DC | 220-221 | Highest |
| New York | 218-219 | High |
| Maryland | 218-219 | High |
| Texas | 217-219 | Moderate-High |
| Florida | 215-217 | Moderate |
| Ohio | 214-216 | Moderate |
| Tennessee | 213-215 | Moderate |
| Wyoming | 209-212 | Lower |
| West Virginia | 207-210 | Lowest |
Typical Semifinalist cutoff ranges by state. Exact cutoffs published each September by NMSC. Ranges reflect 2020-2025 annual variation.
These figures are typical historical ranges, not exact annual guarantees. The NMSC publishes the official cutoffs each September when Semifinalist letters go out. Students applying from high-cutoff states need a higher Selection Index than students in lower-cutoff states to reach the same recognition tier.
Use Classeva's National Merit Probability Calculator to model your estimated cutoff odds based on your state and current practice scores before test day.
National Merit Probability Calculator
Enter your state and estimated PSAT area scores to see how your projected Selection Index compares to your state's historical Semifinalist cutoff range.
Finalists and Scholars: The Final Stages
Roughly 15,000 Semifinalists, about 94% of the group, advance to Finalist status after completing an application reviewed by the NMSC. From that Finalist pool, approximately 7,500 receive Merit Scholarship awards. The other ~7,500 Finalists receive no scholarship from NMSC but may still earn college-sponsored National Merit awards.
Commended Student
Top ~3.3% of all PSAT/NMSQT scorers receive Commended recognition. Announced in September of senior year along with Semifinalists. Does not advance to scholarship competition.
Semifinalist
Top ~1% of test takers per state. Announced September of senior year. Receive a Semifinalist letter through their high school. Must complete the Finalist application to continue.
Finalist
Roughly 95% of Semifinalists who submit complete applications advance to Finalist. Announced February of senior year. Finalists compete for three types of scholarship awards.
Merit Scholarship Winner (Scholar)
Approximately 7,500 Finalists receive Merit Scholarship awards from NMSC, corporate sponsors, or college sponsors. Notified April through June of senior year.
College-Sponsored Award (separate process)
Many colleges independently offer large National Merit Scholarships to Finalists who enroll and name that college as their first choice. These awards can dwarf NMSC's own $2,500 stipend.
How Do You Become a National Merit Finalist?
Advancing from Semifinalist to Finalist requires completing the Finalist application by early fall of senior year. The NMSC reviews the application against academic, conduct, and citizenship standards. Students who submit complete, qualifying applications advance at roughly a 94-95% rate.
The Finalist Application Requirements
The Finalist application includes four components: a detailed academic record (high school transcript, course rigor, GPA), a personal essay, a school counselor recommendation and personal statement, and an official SAT score report. All four components must be submitted to the NMSC through the student's high school by the October deadline.
The Finalist essay is reviewed for writing quality and academic seriousness, not a particular topic. The NMSC publishes guidelines each year for what the essay should address. Start drafting in September rather than waiting until the October deadline. Students who treat this as a shorter college essay tend to produce stronger submissions.
Confirming PSAT Performance With SAT Scores
The Finalist application requires submitting an SAT score that "confirms" the student's PSAT performance. The NMSC does not publish an exact confirmation threshold, but students whose SAT scores fall significantly below their PSAT scores may not advance. Most counselors recommend having an SAT score close to or above your PSAT score before applying.
This is where the PSAT-to-SAT relationship matters practically. A student with a Selection Index of 219 on the PSAT should aim for an SAT score that reflects comparable ability. Use Classeva's PSAT to SAT Predictor to see what your current PSAT score projects to on the SAT, and whether you need additional SAT preparation before submitting the Finalist application.
PSAT to SAT Score Predictor
Enter your PSAT section scores to see your projected SAT range, your estimated Selection Index, and whether your scores fall within your state's Semifinalist cutoff band.
How Much Money Is in National Merit Scholarships?
The National Merit Scholarship Corporationdistributes approximately $28 million annually across roughly 7,500 scholarships. The NMSC's own awards represent just one part of the money available through the National Merit program.
Three Types of National Merit Scholarships
| Award Type | Amount | Who Gives It | Approx. Count |
|---|---|---|---|
| National Merit Scholarship | $2,500 (one-time) | NMSC directly | ~2,500 winners |
| Corporate-Sponsored | $500-$10,000/year | Employers and foundations | ~1,000 winners |
| College-Sponsored | Varies (some full tuition) | Individual colleges | ~4,000 winners |
Source: National Merit Scholarship Corporation. College-sponsored awards vary significantly by institution and require naming that college as first-choice destination.
The college-sponsored awards are often the most financially significant. Many universities, particularly those trying to attract high-achieving students, offer large merit awards to Finalists who name them as their first-choice institution. Some offer annual renewable scholarships worth $10,000 to $25,000. A Finalist comparing colleges should research each school's National Merit scholarship terms directly.
See the PSAT Percentile Lookup to understand how your score compares nationally across recent test years, separate from the state-based cutoff analysis.
Should You Specifically Prep for the PSAT?
For most students, PSAT scores fall naturally from SAT preparation. The content, adaptive structure, and question types are nearly identical. A student who has been preparing for the Digital SAT's adaptive module structure does not need a separate PSAT prep track.
When PSAT Prep Pays Off
Targeted PSAT preparation makes sense in one specific scenario: you are within 3-5 Selection Index points of your state's historical Semifinalist cutoff. A student at 214 in a state with a 218 cutoff has a concrete, achievable target. A student at 205 in that same state needs a significantly larger improvement, making SAT prep the better use of time for both PSAT and college admissions purposes.
The Desmos calculator strategy and Reading and Writing strategy transfer directly to the PSAT. Both posts cover the Digital SAT but the structure is identical. Students who build Desmos fluency before October will benefit on both tests.
Timing and Approach: A Realistic Plan
The most productive prep window for the PSAT opens in the spring of sophomore year, roughly six months before the October junior-year test. At that point, students have enough academic foundation to benefit from targeted practice but enough time to build meaningful score gains. A student who waits until September faces a compressed timeline with limited room for improvement.
For students targeting the upper tier of National Merit eligibility (Selection Index 218+), focused work on Math area score typically yields the most points. Reading gains come slower and require consistent practice over months, not weeks. Writing/Language improvements often come faster through deliberate grammar and rhetoric review. Given the three-component formula, a 2-point gain in each area score raises the Selection Index by 6 points.
Because the PSAT and SAT share the same format and question types, time spent on PSAT preparation counts toward SAT readiness. Students targeting National Merit are not splitting their prep investment. They are building directly toward both the PSAT cutoff and the SAT confirmatory score the Finalist application requires.
Key Takeaways
- The PSAT/NMSQT scores 320-1520, not 400-1600. The difference matters when reading score reports and comparing to SAT targets.
- The Selection Index drives National Merit eligibility, not the total score. Calculate it from your three area scores (8-38 each): 2 × (Reading + Writing/Language + Math).
- Your state determines your cutoff. California and New Jersey consistently require Selection Indices of 220-222. West Virginia and Wyoming see cutoffs 10-15 points lower. Know your state before setting a target.
- Semifinalist status in September triggers the Finalist application, which requires a school counselor recommendation, academic record, personal essay, and an SAT score confirming PSAT performance.
- NMSC's own $2,500 scholarship is not the largest prize. College-sponsored National Merit awards at many universities can reach full tuition for Finalists who enroll and designate that school as their first choice.
- PSAT prep and SAT prep overlap nearly completely. Students within 3-5 points of their state's cutoff benefit from focused preparation; students further away should prioritize SAT prep for admissions purposes and allow the PSAT score to follow.
- There is no retake. The junior-year October test is the only PSAT/NMSQT administration that counts for National Merit. Plan the prep timeline accordingly.