Average SAT Scores at Top Colleges 2026: Your Targets
The most useful number for SAT targeting is not the average SAT scores colleges report. It is the 25th to 75th percentile band published in each school's Common Data Set, and almost no ranking list shows it clearly. A school that lists an “average” of 1520 might enroll students from 1490 all the way to 1580, and where you land inside that spread changes everything about your odds. This post pulls the actual percentile ranges from school-level Common Data Sets and groups them by tier, so you can place your own score against a real target rather than a misleading midpoint.
Why Average SAT Scores Mislead You
Average SAT scores colleges advertise compress a wide distribution into one number that hides the spread you actually care about. The Common Data Set never reports a mean. It reports the 25th and 75th percentiles, which mark the boundaries of the middle 50% of enrolled students. That range tells you the competitive zone; a single average tells you almost nothing about whether your score helps or hurts.
Reading hundreds of Common Data Sets while building Classeva's score-targeting tools, the thing that stood out was how rarely two schools with the same advertised average actually share the same band. One school's 1520 average might span 1480 to 1560, while another's identical 1520 average spans 1500 to 1580. The averages match. The applicant who scored 1510 is competitive at the first school and below the floor at the second. The spread, not the center, decides where you stand.
What the 25th and 75th Percentile Actually Mean
The 25th percentile means 25% of enrolled students scored at or below that number, and 75% scored above it. The 75th percentile flips it: 75% scored at or below, and the top 25% scored higher. The middle 50% of the class falls between those two marks. When Harvard reports a 25th percentile near 1490 and a 75th near 1580, one in four admitted students scored under 1490, and one in four scored above 1580.
The Common Data Set is a voluntary standard that more than 1,000 US colleges complete every year using identical question numbering. Section C9 holds the SAT and ACT percentile data, scored against the College Board score scale of 400 to 1600. Because every school answers the same questions the same way, the CDS is the one source where you can compare schools without a third party reshaping the numbers.
How to Read Your Score Against the Band
Place your composite against the published range, then read your position. Above the 75th percentile, your score strengthens your file. Inside the band, your score neither helps nor hurts much; the rest of the application decides. Below the 25th percentile at a test-required school, your score actively works against you, and you need the rest of the application to overcome it.
What SAT Scores Does the Ivy League Want?
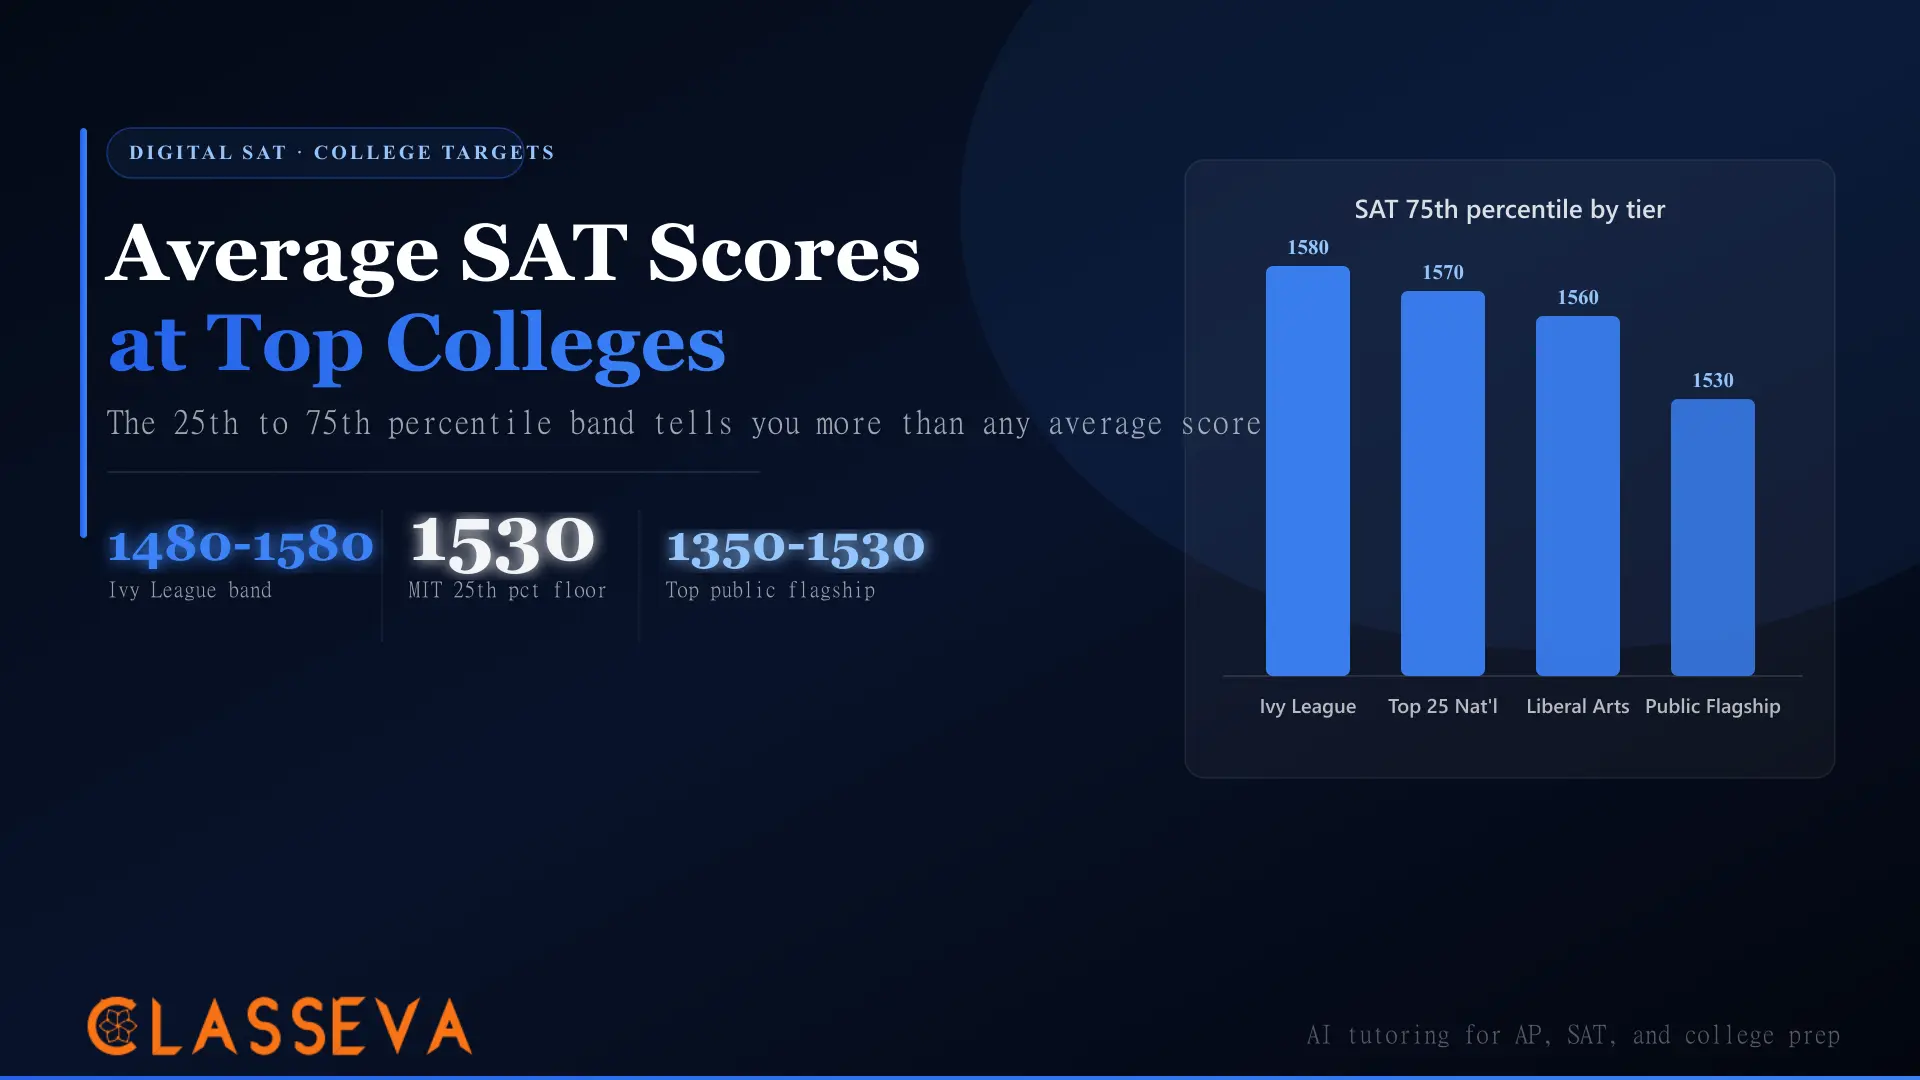
The Ivy League middle 50% clusters tightly between roughly 1480 and 1580, based on 2023-24 Common Data Sets such as the Harvard Common Data Set. [VERIFY: each school's CDS Section C9, 2023-24] Harvard, Yale, and Princeton anchor the top with 75th percentiles at 1580. To sit competitively at any Ivy, aim for the upper half of its band, which usually means 1540 or higher.
Ivy League and Peers: Percentile Bands
| School | 25th Percentile | 75th Percentile | Source |
|---|---|---|---|
| Harvard | ~1490 | 1580 | CDS 2023-24 |
| Yale | 1500 | 1580 | CDS 2023-24 |
| Princeton | 1500 | 1580 | CDS 2023-24 |
| MIT | 1530 | 1580 | CDS 2024-25 |
| Stanford | 1510 | 1570 | CDS 2024-25 |
| Duke | 1490 | 1560 | CDS 2023-24 |
Middle 50% SAT bands from each school's Common Data Set Section C9. [VERIFY: confirm against latest CDS releases]
The narrowness of these bands carries a message. A 30-point gap between schools moves you from the middle to the edge of a class. At Harvard, a 1490 sits at the 25th percentile, while at MIT that same 1490 falls below the 25th percentile entirely. The same score reads differently depending on the school's floor, which is exactly what an average score erases.
MIT and Stanford: The Highest Floors
MIT reports the highest 25th percentile of any school in this group, near 1530, which means three in four enrolled students scored above 1530. [VERIFY: MIT CDS 2024-25 Section C9] Stanford runs slightly wider at roughly 1510 to 1570. A high floor matters more than a high ceiling: it signals that even the bottom quarter of the class scored near the top of the scale, so a sub-1500 score faces a steeper climb at MIT than at most Ivies.
The gap between MIT's floor and a typical Ivy floor looks small on paper. It is not. MIT's ~1530 25th percentile sits 40 points above Harvard's ~1490, and on the digital SAT, 40 points near the top of the scale represents only a handful of additional correct answers across two modules. Those few questions separate the candidate who clears the floor from the candidate who needs the rest of the file to compensate. For STEM-heavy schools, the math section carries extra weight inside that band, so a lopsided 800 math with a weaker reading score often reads stronger than a balanced composite at the same total.
When comparing schools, read the 25th percentile first, not the average. A high 25th percentile means even the lower quarter of the class scored well, so the school leaves little room for a low score. MIT's ~1530 floor is the toughest in this group; the University of Michigan's ~1350 floor leaves far more room.
Top 25 National Universities SAT Ranges
Outside the Ivies, top 25 national universities mostly run 1450 to 1560 for the middle 50%. [VERIFY: each school's CDS] Vanderbilt and Northwestern sit near the top of this group, while schools like Notre Dame report slightly lower 25th percentiles. The pattern holds across the tier: the higher the school's selectivity, the higher and tighter its band.
| School | 25th Percentile | 75th Percentile | Source |
|---|---|---|---|
| Vanderbilt | 1510 | 1560 | CDS 2023-24 |
| Notre Dame | 1440 | 1540 | CDS 2023-24 |
| University of Michigan | 1350 | 1530 | CDS 2023-24 |
| University of Virginia | 1410 | 1530 | CDS 2023-24 |
Selected top national universities, middle 50% SAT bands. [VERIFY: confirm exact figures against each school's CDS]
Vanderbilt's 1510 floor places it alongside Stanford, a reminder that a high SAT band does not track perfectly with US News ranking. For students deciding where they sit, the Vanderbilt admissions breakdown and the Notre Dame admissions guide walk through how these schools weigh scores against the rest of the file.
What SAT Scores Do Top Public Flagships Want?
Top public flagships report wider and lower 25th to 75th percentile bands than peer private universities. The University of Michigan Common Data Set runs about 1350 to 1530, and the University of Virginia runs about 1410 to 1530, both with floors well below any Ivy. [VERIFY: UVA and UMich CDS Section C9] Larger class sizes and substantial in-state cohorts widen the spread.
In-State vs Out-of-State and Test-Free UCs
At public flagships, out-of-state applicants often face a higher effective bar than the published band suggests, because in-state students fill a large share of seats with broader score profiles. The published range averages both pools. The University of California system adds a twist: UC Berkeley, UCLA, and the other UCs are test-free, meaning they do not consider SAT scores at all, even if submitted.
Do not apply a flagship's published SAT band to your out-of-state odds without adjustment. The range blends in-state and out-of-state students. As an out-of-state applicant, treat the school's 75th percentile as closer to your real target than its median. For UC schools, ignore SAT scores entirely; they are test-free and will not read your scores.
Students weighing the cost difference between resident and non-resident tuition should pair the score data here with the in-state vs out-of-state tuition breakdown, since a marginal out-of-state admit often pays a far higher sticker price for the same degree.
Top Liberal Arts College SAT Ranges
Top liberal arts colleges run roughly 1450 to 1560 for the middle 50%, often a notch below their national-university peers despite comparable selectivity. [VERIFY: Williams and Amherst CDS Section C9] Williams and Amherst, the two most selective, report 75th percentiles around 1540 to 1560. Smaller class sizes and a heavier emphasis on fit, interviews, and writing pull some weight off the raw score at these schools.
Top Liberal Arts Colleges
- •Williams middle 50% near 1450-1540 [VERIFY]
- •Amherst middle 50% near 1450-1560 [VERIFY]
- •Smaller classes weigh interviews and writing more
- •Often a notch below national-university peers
- •Strong fit and essays can offset a mid-band score
Top National Universities
- •Vanderbilt and Northwestern near 1500-1560
- •Larger applicant pools, more score-driven sorting
- •Higher 25th percentile floors than most LACs
- •Research depth and prestige drive applicant volume
- •Score sits closer to a gating factor early in review
The takeaway is not that liberal arts colleges are easier. Their acceptance rates rival the national universities. The difference is that a 1500 at a top liberal arts college often lands you higher in the band than the same 1500 at a peer national university, which gives the rest of your application more room to carry you.
How Test-Optional Inflates Reported Ranges
Test-optional policies push published SAT ranges upward through a selection effect. Students with lower scores withhold them, so only stronger scores reach the reported pool. The 25th to 75th percentile band you read for a test-optional school reflects the students who chose to submit, not the full enrolled class. Treat any post-2021 range as an upper-bound target.
The size of the distortion depends on the submission rate. At a school where 70% of admits submitted scores, the band stays close to honest. At a school where only 40% submitted, the published 25th percentile can sit 30 to 50 points above where the true class median falls. Many institutions report the submission rate in Section C9 alongside the percentiles, so check that number before you trust the band. A high range paired with a low submission rate means the school admitted plenty of students who never sent a score at all.
Should You Submit Your Score?
Submit when your score lands in or above the school's published 25th to 75th percentile band. Withhold when it falls below the 25th percentile at a test-optional school, since a low score can only pull the application down. The decision flips at test-required schools like Harvard and most Ivies, where you must submit regardless. Check each school's current policy in the 2026 test-optional policy guide before deciding.
Convert Your ACT Score to SAT
If you tested with the ACT, you cannot compare directly against an SAT band without converting first. The College Board and ACT concordance tables map a 34 composite to roughly 1500 to 1530 SAT and a 36 to 1570 to 1600. Run your composite through the converter, then line the result up against the percentile tables above.
SAT-ACT Converter
Convert your ACT composite to an equivalent SAT score using the official concordance, then compare it against the 25th to 75th percentile bands for your target colleges.
For a deeper look at the conversion math and where it breaks down at the top of the scale, the ACT to SAT score conversion guide walks through the full concordance, and what counts as a good SAT score sets percentile context before you compare schools.
How to Build a Score-Based College List
Sort every target school into reach, match, or safety using its percentile band, not its average. A reach school's band sits above your score. A match school brackets your score inside its band. A safety school's band sits well below your score. Balance the list so you carry several of each, weighted toward matches.
| Category | Where Your Score Sits | How Many to Apply To |
|---|---|---|
| Reach | Below the school's 25th percentile | 3 to 5 schools |
| Match | Inside the 25th to 75th band | 4 to 6 schools |
| Safety | At or above the 75th percentile | 2 to 3 schools |
A balanced score-based list weights toward matches, with reaches and safeties on either side.
One caution: a strong SAT band is necessary, not sufficient. The most selective schools reject thousands of applicants who scored above the 75th percentile every year, because holistic review weighs essays, rigor, and activities heavily. Use the band to gate your list, then build the rest of the application to win inside it. For the schools where a few percentile points decide everything, the safety, match, and reach list framework shows how to balance the full set.
Key Takeaways
- The average SAT scores colleges publish hide the real target. The Common Data Set Section C9 reports the 25th and 75th percentile range, which is the number that tells you whether a school is a reach, match, or safety.
- The Ivy League and peers cluster in a 1480 to 1580 band. Harvard, Yale, and Princeton post the highest 75th percentiles at 1580; MIT posts the highest 25th percentile floor near 1530. [VERIFY]
- Top 25 national universities mostly run 1450 to 1560. Vanderbilt and Northwestern sit near the top of the tier, with higher 25th percentile floors than most liberal arts colleges.
- Public flagships carry the lowest floors. The University of Michigan runs about 1350 to 1530 and the University of Virginia about 1410 to 1530, with wide bands that blend in-state and out-of-state pools. UC schools are test-free.
- Top liberal arts colleges run roughly 1450 to 1560, often a notch below their national-university peers, with more weight on fit, interviews, and writing.
- Test-optional policies inflate reported ranges. Lower scorers withhold, so the published band drifts upward. Treat post-2021 ranges as upper-bound targets and submit only when you land in the band.
- Read the 25th percentile first. The floor separates the tiers more than the ceiling does, and it tells you how much room a school leaves for a lower score.