Net Price vs Sticker Price: What Top Colleges Cost
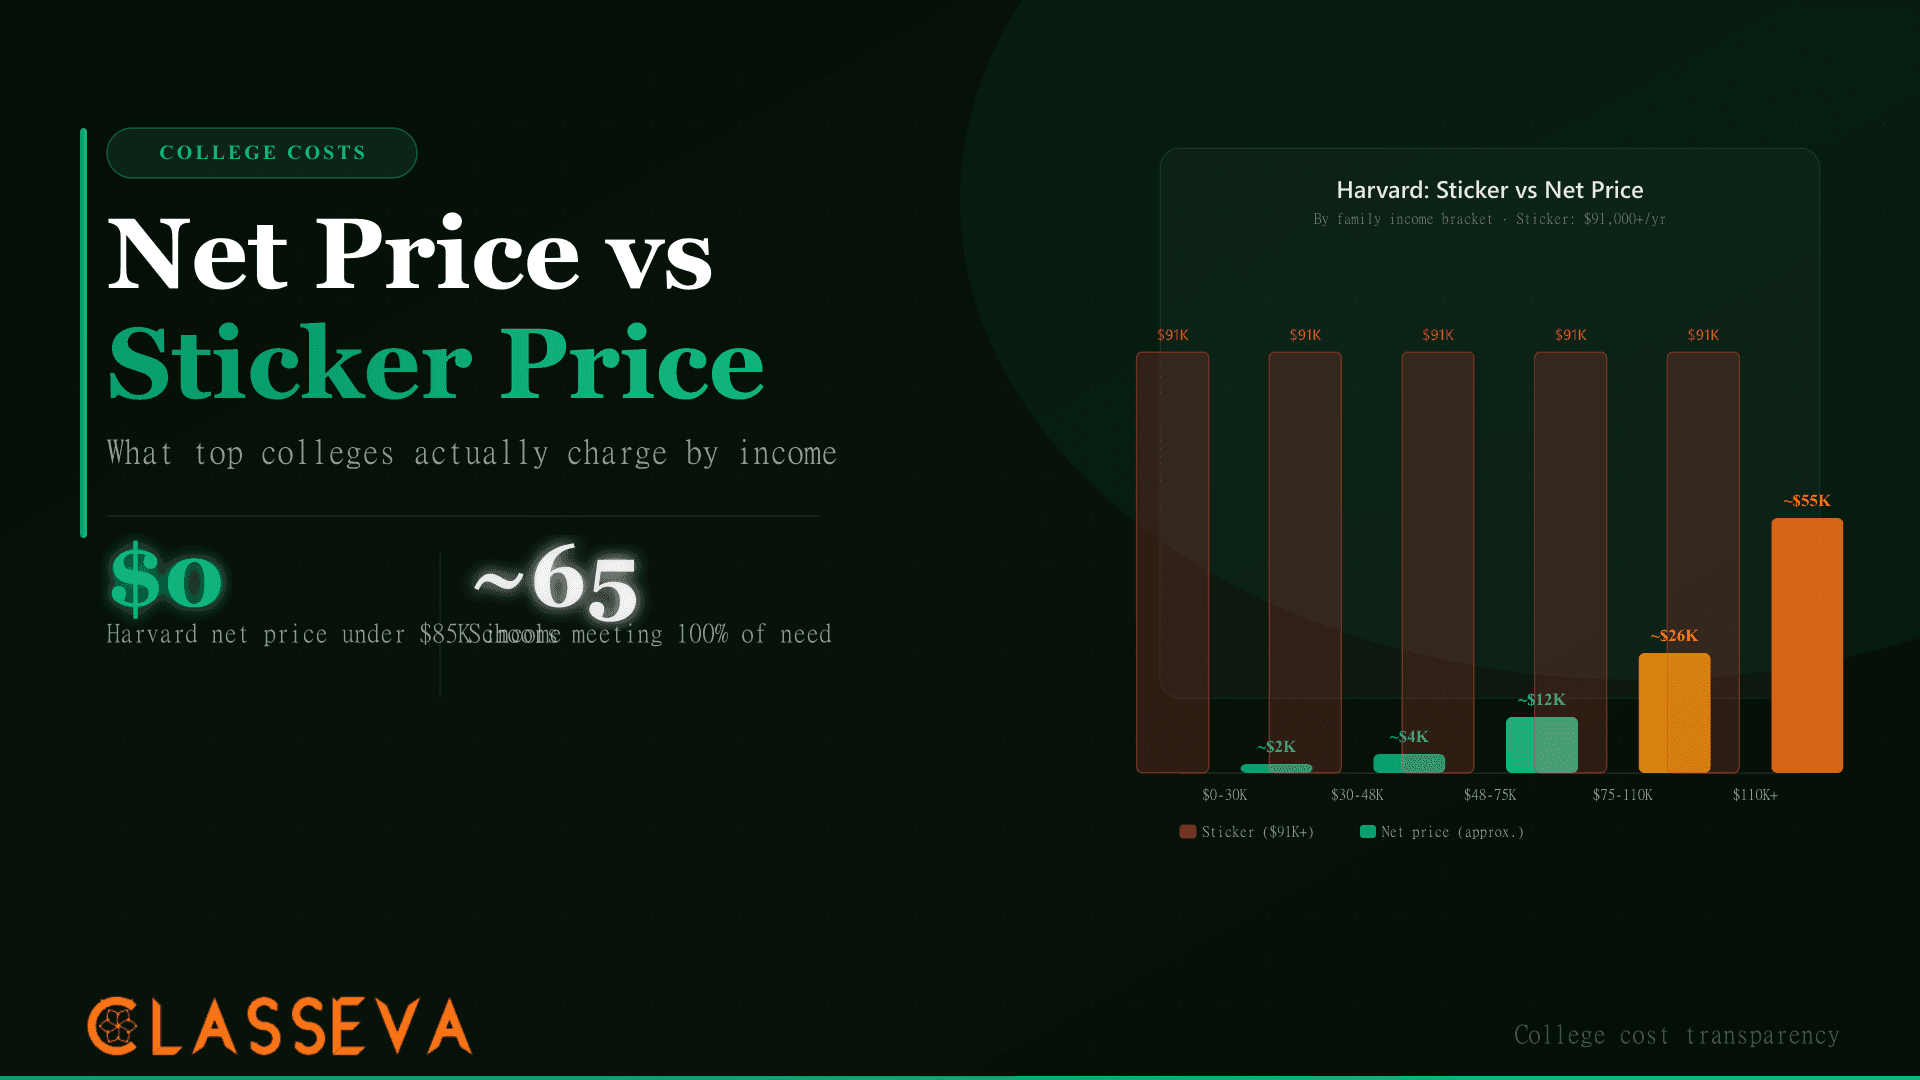
Harvard’s sticker price exceeds $91,000 for the 2024-25 academic year. For a family earning $65,000, the actual net price after grants that never need to be repaid runs to zero. That figure doesn’t come from marketing material. It comes from Harvard’s published financial aid policy and from the Common Data Set Section H filing the university submits annually, as does every Title IV-participating institution in the country.
Reading CDS Section H data across the most selective universities in the US, the same pattern repeats: sticker price is the number almost no family pays, the gap between sticker and actual cost scales dramatically with income, and the schools with the highest advertised prices are often the cheapest for middle-income students. Princeton, Yale, MIT, and Stanford all publish similar commitments. The families who pay closest to the full sticker price are those earning $250,000 or more with limited financial circumstances that reduce their calculated need.
What Is the Difference Between Net Price and Sticker Price?
The sticker price is the full published cost of attendance before any financial aid applies. It includes tuition and fees, room and board, books and supplies, and personal and transportation expenses. The net price is what a family actually pays after subtracting grants and scholarships that don’t need to be repaid. At selective private universities with strong endowments, the gap between these two numbers can reach $80,000 per year for qualifying middle-income families.
What the Sticker Price Actually Includes
Cost of attendance at most four-year colleges covers four categories. Tuition and fees run $60,000 to $65,000 at top private universities in 2024-25. Room and board adds $18,000 to $22,000. Books, supplies, and personal expenses contribute another $4,000 to $7,000. Harvard’s 2024-25 cost of attendance estimate, per the university’s financial aid office, exceeds $91,000 when all categories are included.
State universities carry significantly lower sticker prices for in-state students. UC Berkeley’s total cost of attendance for California residents runs approximately $36,000 to $40,000 per year, depending on housing choice. That number looks much more affordable on the surface. Whether it actually is depends on how much aid each school offers, which is where the comparison shifts.
How Grant Aid Reduces What You Owe
Grant aid, unlike loans, requires no repayment. Three sources fund grant packages: federal grants (the Pell Grant, worth up to $7,395 for the 2024-25 award year for families with the greatest financial need), state grants, and institutional grants from the college itself. At schools that meet 100% of demonstrated need, institutional grant aid carries the heaviest load, often covering $50,000 to $85,000 per year for families earning below the school’s income thresholds.
CDS Section H reports the average net price paid by undergraduates who received Title IV aid, broken into five income brackets: $0-30K, $30-48K, $48-75K, $75-110K, and $110K+. Every accredited college that participates in federal financial aid must publish this data annually. It is the most reliable comparison tool available for estimating what a school actually charges.
What Do Top Colleges Actually Cost by Income Bracket?
For families earning under $48,000 per year, the average net price at Harvard, Princeton, and Yale is effectively $0, based on the universities’ published aid policies. For families earning $75,000 to $110,000, the net price at these institutions runs roughly $15,000 to $30,000 annually, still far below their $90,000+ sticker prices. Meanwhile, UC Berkeley’s net price for California residents in that same income bracket averages $18,000 to $26,000, confirming that private and public prices converge for many families.
| Income Bracket | Harvard (est.) | Princeton (est.) | Yale (est.) | UC Berkeley (CA) |
|---|---|---|---|---|
| $0 – $30,000 | $0 – $2K | $0 – $1K | $0 – $2K | $3K – $7K |
| $30,001 – $48,000 | $0 – $4K | $0 – $3K | $0 – $3K | $7K – $12K |
| $48,001 – $75,000 | $4K – $14K | $3K – $12K | $5K – $14K | $12K – $18K |
| $75,001 – $110,000 | $16K – $30K | $14K – $28K | $18K – $32K | $18K – $26K |
| $110,001+ | $40K – $65K | $35K – $60K | $42K – $65K | $28K – $38K |
Approximate net prices based on published aid policies and recent CDS Section H averages. Figures vary by family assets, household size, and aid formulas. Verify at each school's Net Price Calculator.
Where Harvard’s $0 Net Price Applies
Harvard’s financial aid policy, published on the university’s financial aid website, commits that families earning less than $85,000 annually pay nothing for tuition, room, board, or fees. Families earning between $85,000 and $150,000 pay no more than 10% of their annual income. A family earning exactly $100,000 pays a maximum of $10,000 per year. That figure sits below in-state tuition at many state flagships before room and board is added.
The policy covers all students admitted under Harvard’s standard admissions process, regardless of nationality. Harvard extends this aid to international students, which few other schools do. The commitment also covers all four years, not just freshman year, though the specific dollar amount adjusts annually with each new FAFSA submission.
Princeton and Yale: Comparable Generosity, Different Thresholds
Princeton commits that families earning under $100,000 pay nothing, a slightly more generous threshold than Harvard’s $85,000 benchmark. Yale’s threshold sits at $75,000. Stanford commits to no tuition for families earning under $75,000, with room and board also covered at lower income levels. MIT reports that approximately 60% of enrolled students receive need-based scholarships, with the average institutional grant covering roughly $50,000 per year.
Each school uses slightly different need-analysis formulas and asset-weighting methodologies. A family sitting right at a threshold may receive meaningfully different aid offers from schools with similar stated policies. That gap is why checking each school’s Net Price Calculator directly, rather than relying on published income thresholds alone, produces the most accurate estimates.
Why Is the Ivy League Sometimes Cheaper Than Your State Flagship?
At a meets-100%-demonstrated-need school, a family earning $65,000 often pays less than they would at a state university, because the institutional grant completely covers the gap between demonstrated financial need and the full cost of attendance. State schools, operating with smaller endowments and larger student bodies, typically cannot close that gap with grants alone, leaving families to borrow or work to cover the remainder.
What “100% of Demonstrated Need” Actually Means
Demonstrated need is the gap between a college’s cost of attendance and the Student Aid Index (SAI), the figure the FAFSA produces to estimate what a family can reasonably contribute. When a school meets 100% of demonstrated need, it commits to covering that entire gap with grants, not loans. No unmet need remains in the financial aid package at admission.
The catch: “demonstrated need” reflects what the school’s formula calculates, not necessarily what a family expects their need to be. A family earning $120,000 with significant savings, two incomes, and no unusual financial circumstances may calculate minimal demonstrated need even though college feels expensive. Different schools also weight assets differently, so the same family can receive sharply different need calculations at different institutions.
Which Schools Make This Commitment
The approximately 65 US colleges that publicly commit to meeting 100% of demonstrated need include all eight Ivy League institutions (Harvard, Yale, Princeton, Columbia, Cornell, Dartmouth, Brown, Penn), MIT, Stanford, Caltech, Duke, Vanderbilt, and a group of highly selective liberal arts colleges including Amherst, Williams, Wellesley, Swarthmore, and Pomona. Most carry acceptance rates below 25%.
Meeting 100% of need at scale is expensive. It requires a large endowment that generates enough annual return to fund grant packages averaging $50,000-$70,000 per student. Harvard’s endowment exceeded $50 billion as of 2024; Princeton’s exceeded $34 billion. Schools with smaller endowments cannot sustain this commitment, which is why the list remains limited to institutions with exceptional financial resources.
A family earning $70,000 annually will typically pay less at Harvard, Princeton, or Yale than at their in-state public university, because the Ivy League grant covers the full demonstrated need while most public universities leave a substantial unmet gap. The admission process is more selective, but the price for qualifying families is genuinely lower.
Who Actually Pays the Sticker Price?
Families earning $200,000 or more annually, with substantial assets and no unusual financial circumstances, typically pay close to the full sticker price at most selective universities. At Harvard, approximately 14% of enrolled students pay the full cost of attendance, per the university’s financial aid data. That group sits predominantly in the top 5% of the US income distribution.
Who Gets Significant Aid
- •Families earning under $85K at Harvard, $100K at Princeton
- •Families earning under $75K at Yale and Stanford
- •Students at any of the ~65 meets-100%-need schools with income below thresholds
- •Federal Pell Grant recipients (SAI below ~$8,000)
- •Students at any school with strong merit or need-based institutional grants
Who Pays Near Sticker
- •Families earning $200K+ with typical assets at meets-100%-need schools
- •All families at schools that don't meet 100% of demonstrated need
- •Families with significant business equity or investment assets that raise calculated need
- •Students at schools with weak endowments and limited institutional aid budgets
- •International students at schools without international aid programs
High-Income Families and Full-Price Reality
The families who pay the full $91,000+ sticker price at Harvard are those whose financial aid formula produces minimal demonstrated need. A household earning $300,000 with $500,000 in non-retirement savings and two working adults generates a high SAI, which means the gap between cost of attendance and their calculated contribution is small. The school’s commitment to cover 100% of demonstrated need then results in a modest grant that barely reduces the bill.
At this income level, the private-versus-public comparison inverts. A well-funded state flagship at $20,000 to $25,000 per year in-state tuition and fees costs significantly less than a private university charging near sticker, even before accounting for room and board. The financial case for an elite private school depends almost entirely on what the aid formula produces for a specific family’s circumstances.
The Middle-Income Squeeze at Schools Without Strong Aid
The most financially precarious position: families earning $80,000 to $150,000 at schools that don’t meet 100% of demonstrated need. Federal Pell Grant eligibility phases out above an SAI of roughly $8,000, so these families receive little or no federal grant aid. State grants similarly taper off at moderate incomes. If the college’s institutional aid budget is thin, the family faces a large unmet need gap that often becomes student loan debt. A school with a $35,000 sticker price that meets only 60% of need leaves a $14,000 annual gap for a family with $35,000 in demonstrated need. Over four years, that gap compounds to $56,000 in debt at graduation.
How to Calculate Your Likely Net Price
The most accurate way to estimate your actual college cost is to complete the Net Price Calculator on each target school’s website, a tool the federal government requires every Title IV-participating institution to publish and keep updated. Cross-referencing the output against the school’s NCES College Navigator data adds a useful reality check.
Find the Net Price Calculator on each school's financial aid website
Navigate to each target college's financial aid page and locate their Net Price Calculator. Every school that receives Title IV federal aid must publish one. College Navigator at nces.ed.gov also links directly to each school's calculator under the 'Net Price' tab.
Gather your most recent financial documents
Collect your most recent federal tax return (typically the year two years before intended enrollment), bank account statements, investment account statements, and any documentation of unusual financial circumstances such as medical expenses or business losses.
Enter income, asset, and household data accurately
Input exact figures from your tax return, not round estimates. Enter all taxable and untaxed income sources the calculator requests. Household size, number of dependents, and siblings currently in college all affect the output significantly.
Separate grants from loans in the output
When the calculator shows an estimated aid package, identify which components are grants (free money) and which are loans (debt). Your net price equals cost of attendance minus grants and scholarships only. Do not include loans in the free-money total.
Cross-check against CDS Section H income-bracket averages
Look up the school's most recent Common Data Set publication at their institutional research website. Section H shows the average net price paid by students in your income bracket who received Title IV aid. Compare this against your calculator result as a sanity check.
Run this process for every school on your list before applying
A school with a $75,000 sticker price and generous aid may cost less than one with a $30,000 sticker and weak aid. Don't eliminate any school from affordability concerns based on sticker price alone. The net price determines what the family actually pays.
Our College Net Cost Estimator lets you preview estimated costs across multiple school types using income and aid eligibility inputs. Run it before committing to any college list to surface schools where the net price may surprise you.
College Net Cost Estimator
Enter your family income, asset estimates, and target school type to preview estimated net prices across different college tiers. Compare meets-100%-need schools against typical private and public alternatives.
The Limitations of Net Price Calculators
Net price calculators produce estimates, not guarantees. They use income and a limited set of asset fields to generate a rough projection. They don’t model unusual circumstances: medical expenses, business losses, divorce, a sibling with a disability, or recent job loss. The actual award letter you receive may differ from the calculator output by $5,000 to $15,000 in either direction for standard financial situations.
The most effective approach: run each school’s NPC, then look up that school’s CDS Section H averages for your income bracket at theNCES College Navigator. If the calculator output and the CDS bracket average are within $5,000 of each other, trust the range. If they diverge by more, your family’s specific asset profile may push you toward the higher or lower end. An estimated SAI from ourEFC/SAI Estimator sharpens the picture before you formally file the FAFSA.
What About State Schools? Why Are They Often Pricier Than Expected?
State universities carry lower sticker prices for in-state students, typically $20,000 to $40,000 per year depending on the institution, but they generally don’t meet 100% of demonstrated financial need. The result: middle-income families face a gap between what the school calculates as their ability to pay and what the school can offer in grants, and that gap often becomes debt.
The Gap-Funding Problem
When a school doesn’t cover the full gap between cost of attendance and a family’s SAI, that unmet need typically becomes student loan debt. Federal Direct Loans for dependent undergraduates are capped at $5,500 for freshmen, $6,500 for sophomores, and $7,500 for juniors and seniors. Work-study programs add modest income for eligible students. But families earning $80,000 to $120,000 at schools that meet only 60-70% of demonstrated need often graduate with $30,000 to $50,000 in debt even at lower-cost public institutions.
Our Student Loan Payment Calculator shows what different debt loads cost monthly after graduation, at both standard 10-year repayment and income-driven repayment options. Running those numbers before committing to a school is as important as comparing the net price estimates.
When State Schools Win on Price
Two scenarios produce a genuine state school cost advantage. Families earning above $175,000 to $200,000 find that need-based aid at private schools shrinks significantly, while in-state tuition at a well-funded flagship remains $14,000 to $22,000 per year. The four-year savings can exceed $100,000 compared with a private school at near-sticker.
State merit aid programs create a second scenario. Georgia’s HOPE Scholarship, Florida’s Bright Futures program, Tennessee Promise, and similar state-funded awards are available only at public in-state institutions, or a limited set of private colleges in those states. A student who qualifies for a full merit award at a state flagship may genuinely pay less than they would at a private school with strong need-based aid. The Scholarship Probability Estimator helps estimate eligibility for state and institutional merit awards.
The Honest Debt Risk Picture
Studying CDS Section H averages alongside NCES loan data reveals a mismatch many families don’t notice until they open their award letter. The schools with the highest sticker prices are often the lowest-debt schools for middle-income families. The schools with the most approachable sticker prices frequently leave substantial unmet need gaps that convert into debt. Sticker price and debt burden are not the same number.
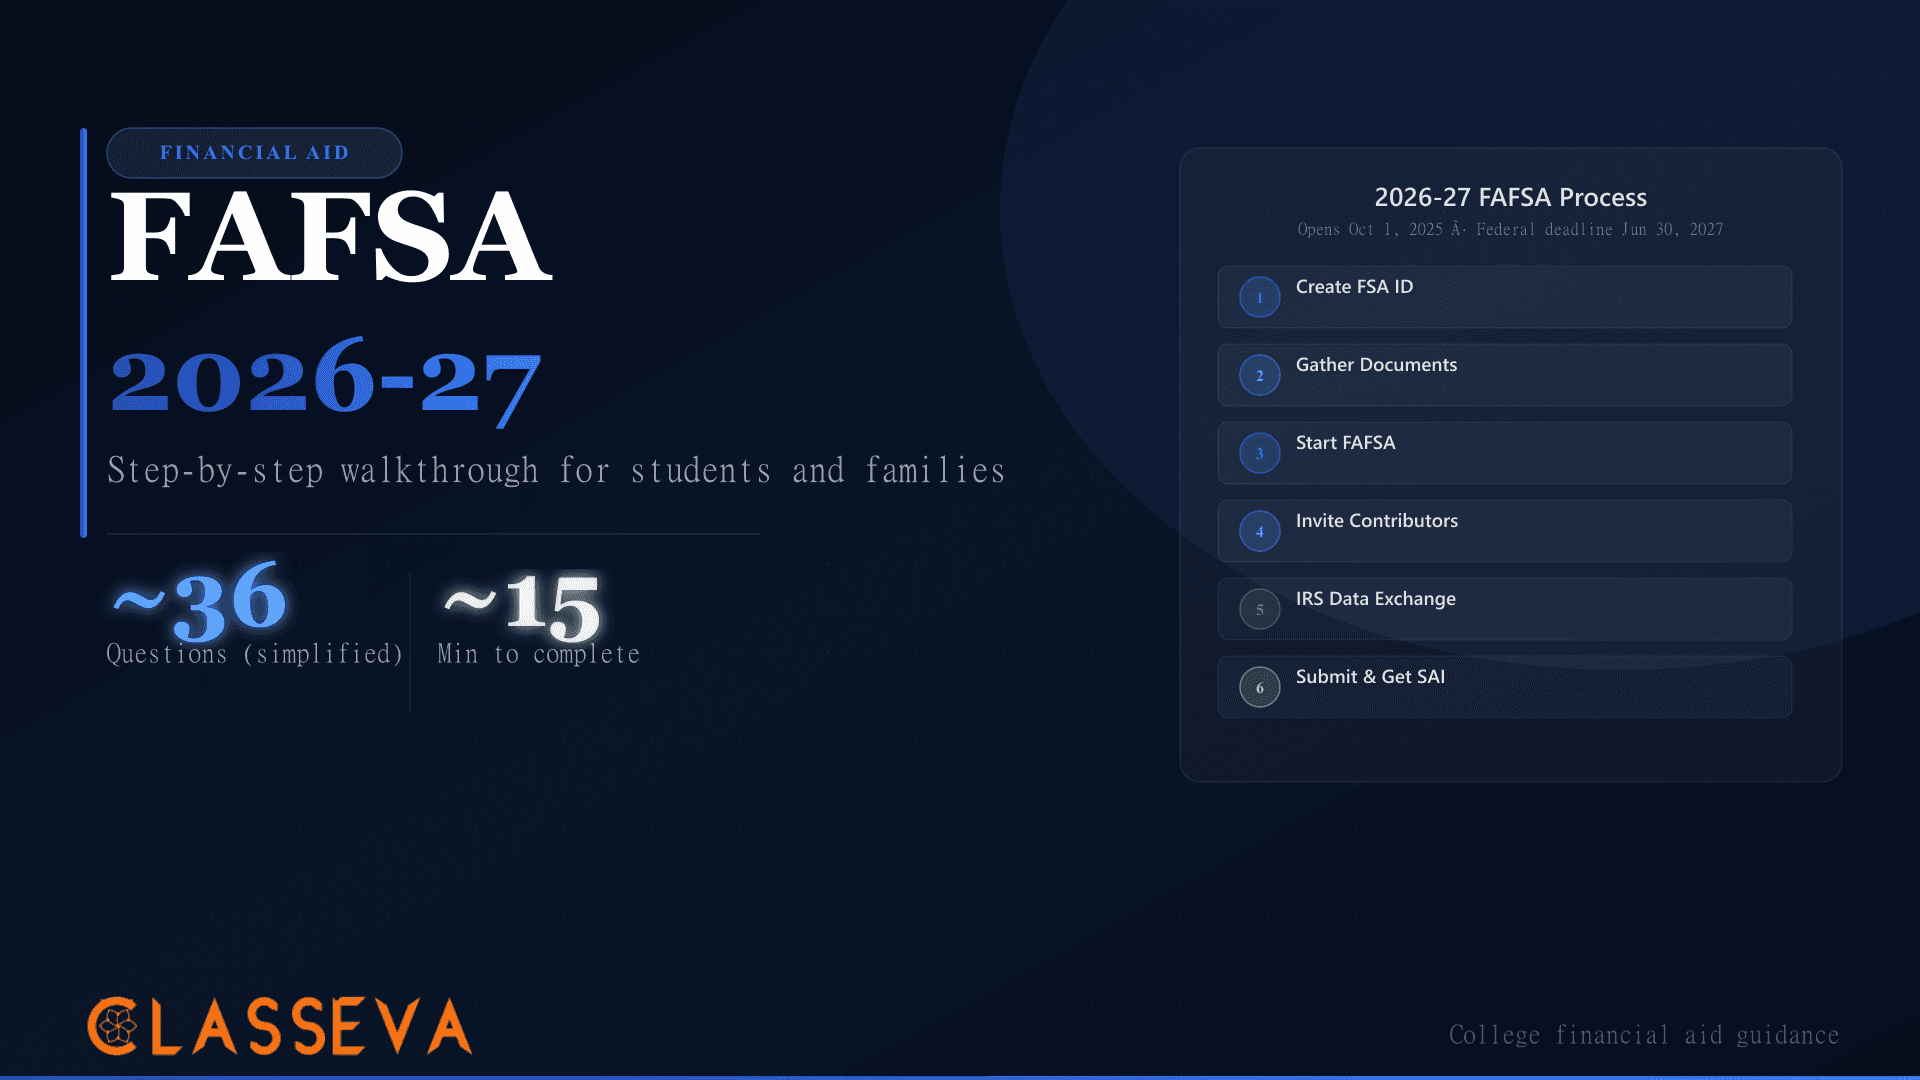
The FAFSA-connected process for applying for financial aid is covered in ourFAFSA 2026-27 Step-by-Step Guide. Filing the FAFSA accurately and on time maximizes the grants and federal aid eligibility that reduce net price before loans enter the picture. The Financial Aid resources hub covers the full aid process from FAFSA to award letter comparison.
When Net Price Becomes Debt
An award letter can look favorable without actually being favorable. Colleges have been required since the 2008 Higher Education Act regulations to list loans separately from grants in official aid packages, but the presentation varies widely across institutions. Some bundle totals in a way that obscures how much is free money versus how much is debt.
Before accepting any package, subtract every loan amount from the total aid figure. The remaining grants and scholarships represent the free money. The loans represent deferred tuition. A package showing $50,000 in total aid might contain $30,000 in grants and $20,000 in loans, producing a true net price of $71,000 if sticker is $91,000 rather than the $41,000 the total aid figure implies.
When comparing financial aid offers from multiple schools, many families compare total aid without distinguishing grants from loans. A school offering $45,000 in grants and $5,000 in loans produces a far better outcome than one offering $30,000 in grants and $20,000 in loans, even if both show $50,000 in “total aid.” Always separate free money from debt before making any college cost comparison.
The financial aid section of our Community College Transfer guide covers how loan exposure differs between transfer students and first-year enrollees, a comparison that matters when evaluating cost-saving alternatives. For students targeting specific universities, the UC System Admissions guide covers UC-specific financial aid policies in detail.
Key Takeaways
- College net price vs sticker price diverges most dramatically at schools with large endowments that meet 100% of demonstrated financial need. Harvard’s $91,000+ sticker price is what virtually no middle-income family actually pays.
- Harvard charges $0 for families earning under $85,000. Princeton’s threshold is $100,000. Yale’s is $75,000. Stanford’s no-tuition commitment covers families under $75,000.
- Approximately 65 US colleges publicly commit to meeting 100% of demonstrated need, covering the gap entirely with grants rather than requiring loans.
- Families earning $250,000 or more typically pay near the full sticker price at meets-100%-need schools, because their calculated demonstrated need is low despite the high absolute cost of college.
- State universities carry lower sticker prices but often leave significant unmet need gaps for middle-income families, creating debt that exceeds what they would have paid at a better-funded private school.
- Award letters must be read carefully: separate every grant from every loan before comparing packages across schools. Total aid and free money are not the same figure.
- Run each school’s Net Price Calculator, cross-check against the CDS Section H income-bracket averages at NCES College Navigator, and compare net prices across your full list before ruling any school unaffordable based on sticker price alone.