Is AP Statistics Hard? Why the 5-Rate Beats AP Calc AB
Looking at the College Board's published score distributions for AP Statistics, the number that stands out is how consistent the pass rate has been across years that tested very different content emphases. AP Statistics has no derivatives, no integrals, no limit definitions. What it does have is a writing requirement embedded in every free-response question: each statistical conclusion must be interpreted in the context of the specific problem. That phrase, interpret in context, separates students who score a 3 from those who score a 5, and most students do not realize how strictly the rubric enforces it until they receive their first FRQ score.
Is AP Statistics Hard?
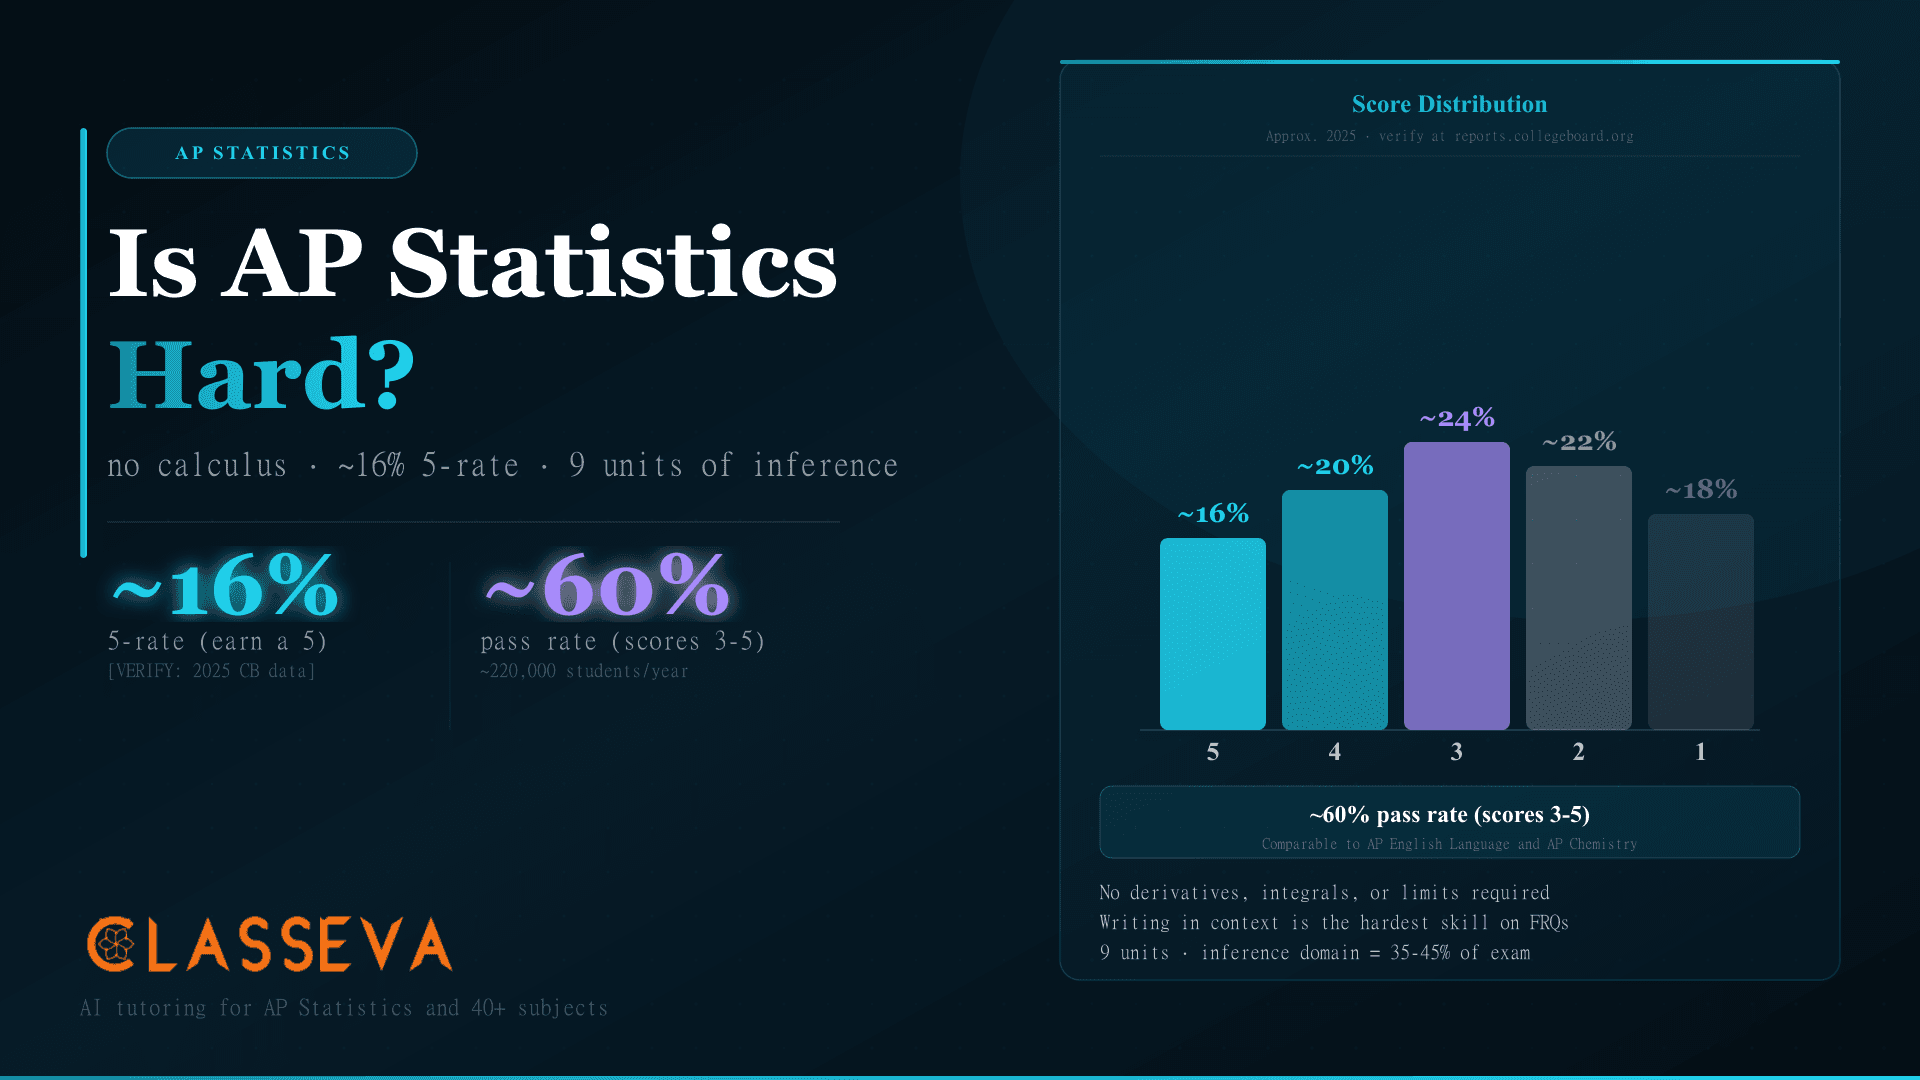
AP Statistics is moderately difficult. The pass rate sits around 58-62% and the 5-rate near 15-17%, placing it alongside AP English Language and AP Biology in the middle tier of AP difficulty. [VERIFY: 2025 College Board AP Score Distributions] The exam draws roughly 220,000 test-takers annually, one of the larger AP programs, which includes students who enter without particularly strong math backgrounds. The 5-rate reflects this: AP Statistics rewards students who combine quantitative accuracy with precise written communication, not just those who are strongest in one dimension.
The AP Statistics Score Distribution
Here is the approximate score distribution for AP Statistics based on recent College Board data. [VERIFY: exact 2025 figures from reports.collegeboard.org]
| Score | Approximate % | What It Means |
|---|---|---|
| 5 | ~16% | Exceptional: college credit at most schools |
| 4 | ~20% | Strong: credit at most schools |
| 3 | ~24% | Pass: credit at some schools |
| 2 | ~22% | Below passing |
| 1 | ~18% | No credit |
Source: College Board AP Statistics Score Distributions (approximate 2025 figures; verify at reports.collegeboard.org). Mean score approximately 2.9-3.1.
The mean score near 3.0 tells you this is a genuinely competitive exam. A score of 3 requires accurate computation plus a correct contextual interpretation on roughly half the FRQs. A score of 5 requires consistently accurate computation plus consistently correct context across all six free-response questions.
How AP Statistics Compares to Other AP Exams
AP Statistics sits in a cluster of popular AP exams with similar difficulty profiles. The 5-rate near 16% is lower than AP Calculus AB (20.3% in 2025) but higher than AP Physics 1 (roughly 7%). For students weighing AP Stats against other options, the comparison below uses 2025 data where available. [VERIFY: 2025 College Board score distributions]
| AP Exam | 5-Rate | Pass Rate | Core Challenge |
|---|---|---|---|
| AP Physics 1 | ~7% | ~43% | Conceptual physics reasoning without calculus |
| AP English Language | ~11% | ~59% | Timed rhetorical writing across 3 FRQs |
| AP Statistics | ~16% | ~60% | Statistical reasoning and writing in context |
| AP Biology | 18.9% | 70.4% | Content breadth and experimental design |
| AP Calculus AB | 20.3% | 64.2% | Derivatives, integrals, and rates of change |
Sources: College Board Score Distributions 2025. AP Statistics and AP English Language figures approximate. [VERIFY at reports.collegeboard.org]
What Does AP Statistics Actually Test?
The AP Statistics exam runs 3 hours and explicitly tests both quantitative reasoning and written communication. The College Board's Course and Exam Description (CED) organizes the course into 9 units across four major content domains: Exploring Data, Sampling and Experimentation, Probability and Sampling Distributions, and Statistical Inference. Inference is the heaviest domain, typically carrying 35-45% of the total exam points. [VERIFY: current CED unit weights]
The 9 Units and Their Exam Weights
Here are the 9 units with their approximate exam weight ranges from the College Board CED. [VERIFY: current CED at AP Central]
The Free-Response Section
Section II runs 90 minutes and carries 50% of the total exam score. There are 6 FRQs in two parts. Part A contains 5 multi-part questions (approximately 65 minutes), and Part B contains 1 investigative task (approximately 25 minutes). Each question in Part A is scored on a 0-4 scale. The investigative task carries the most weight of any single FRQ on the exam.
| Section | Questions | Time | Weight |
|---|---|---|---|
| Section I: Multiple Choice | 40 questions | 90 min | 50% |
| Section II, Part A: FRQs | 5 multi-part questions | ~65 min | 37.5% |
| Section II, Part B: Investigative Task | 1 extended question | ~25 min | 12.5% |
Source: College Board AP Statistics Exam Format. Percentages for Part A and Part B are approximate based on College Board weighting. [VERIFY at apcentral.collegeboard.org/courses/ap-statistics/exam]
The Investigative Task
The investigative task is the most distinctive feature of the AP Statistics exam. Rather than asking one focused question, it presents a multi-part scenario that requires students to synthesize ideas from across the course: designing a study, computing a test statistic, interpreting an inference conclusion, and evaluating an argument. Strong students who rush through Part A often underestimate the investigative task and run short on time.
Spend the first 3-4 minutes reading all parts of the investigative task before answering any of them. The parts are connected, and understanding the full scenario prevents you from writing a Part A answer that contradicts what Part C asks you to evaluate. Time management across the full 25 minutes matters more on this question than any other FRQ.
Why the Writing Component Is the Real Challenge
The arithmetic in AP Statistics is not difficult. Most computations involve plugging values into formulas, pressing calculator buttons, or reading output from a regression printout. The challenge is not the computation. It is writing a sentence that correctly describes what the number means in the context of the specific scenario on the exam.
Reviewing College Board Chief Reader Reports for AP Statistics over the past several years, the most repeated comment on FRQ scoring is some variation of: the student computed the correct value but failed to interpret the conclusion in context. That failure to close the loop between the number and its meaning costs more AP Statistics points than any single computation error.
What Interpret in Context Actually Means
Every AP Statistics inference FRQ asks you to draw a conclusion. The rubric requires that conclusion to include the direction of the finding, the magnitude, and a reference to the specific variables and population in the problem. Without those three elements, the interpretation is incomplete.
For example, if a problem involves a hypothesis test about whether a new teaching method raises exam scores, a rubric-satisfying conclusion sounds like: “Because the p-value of 0.018 is less than the significance level of 0.05, we reject the null hypothesis. There is sufficient evidence that the new teaching method raises mean exam scores for students in this district.” A conclusion that says only “reject the null hypothesis because p < 0.05” earns partial credit at best. The rubric rewards the connection to the real-world claim.
The Most Common FRQ Mistake
The most expensive error on AP Statistics FRQs is writing a numerical answer with no contextual interpretation. This pattern appears across all inference questions: hypothesis tests, confidence intervals, and sampling distributions.
For confidence intervals, the correct interpretation follows the structure: “We are 95% confident that the true [parameter, named specifically] for [population, named specifically] is between [lower bound] and [upper bound].” Saying only “the interval is (3.2, 4.8)” earns no interpretation credit even when the interval is computed correctly.
Computing the correct test statistic, p-value, or confidence interval and then stopping earns partial credit only. Every inference conclusion on AP Statistics requires three elements: the direction of the decision, the magnitude (p-value or interval bounds), and the real-world meaning tied to the specific scenario. Practice completing the interpretation sentence on every FRQ you attempt during the school year, not just in the final weeks before May.
How Does AP Stats Compare to AP Calculus AB?
AP Statistics and AP Calculus AB are the two most common AP math options for juniors and seniors. They sit in different parts of the math curriculum entirely. Calculus AB builds on precalculus and introduces rates of change, accumulation, and the formal limit definition. Statistics builds on algebra and introduces data analysis, probability, and inference. Students who have completed Precalculus can take either, but the skills they exercise in each course are not the same.
AP Statistics
- •Requires: Algebra 2 minimum
- •No derivatives, integrals, or limits
- •40 MC + 6 FRQs including investigative task
- •Writing-intensive: interpret in context
- •Best for: social science, pre-law, non-STEM
AP Calculus AB
- •Requires: Precalculus or equivalent
- •Limits, derivatives, definite integrals
- •45 MC + 6 FRQs (calculator and non-calc parts)
- •Procedural: algebraic manipulation and proof
- •Best for: STEM, engineering, pre-med
When to Choose AP Statistics
AP Statistics is the stronger choice when calculus is not a requirement for your intended major or career path. Psychology, sociology, political science, economics, public health, nursing, education, and pre-law all use statistics regularly and rarely require calculus. A score of 4 or 5 frequently satisfies the introductory statistics requirement that most colleges impose in these programs, saving one course and its associated tuition.
Students heading to business school also benefit more from AP Statistics than AP Calculus AB, since business statistics courses use the exact content AP Statistics teaches: confidence intervals, hypothesis tests, and regression analysis. If you plan to study anything that involves reading or generating research, AP Statistics is more immediately applicable than calculus.
When to Choose AP Calculus
AP Calculus AB is the right choice for students pursuing engineering, physics, computer science, mathematics, or pre-med programs where calculus is a hard prerequisite. STEM majors need derivatives and integrals before they can take the courses that matter most in their major; AP Calculus AB credit often allows them to skip Calculus I and move directly to Calculus II or multivariable calculus.
Some students take both AP Statistics and AP Calculus AB, either in the same year or sequentially. The courses do not conflict and the combination is particularly strong for students heading into data science, economics, or quantitative finance, where both statistical reasoning and calculus-based methods appear in the same work. Use Classeva's SAT-ACT score converter and AP credit savings calculator together to see how AP choices translate into real tuition savings at your target schools.
How Much Should You Study for AP Statistics?
Most students who score a 4 or 5 on AP Statistics study 3-4 hours per week during the school year. The total investment across a full-year course runs roughly 90-130 hours. Unlike AP Calculus, where additional computation practice produces predictable score improvements, AP Statistics gains come from two distinct activities: practicing calculations to build speed and accuracy, and practicing interpretations to build the habit of writing in context. Students who only drill computations plateau around a 3.
A Year-Long Study Timeline
Fall semester (September-December): build the vocabulary and the computation habits
Units 1-5 cover the content that underpins inference. Do not rush through probability and sampling distributions (Units 4-5). Students who skim these units in the fall spend the spring confused about why their p-values and confidence intervals do not make intuitive sense. Practice at least one FRQ per week from October onward, focusing on Units 1-3 questions available at AP Central.
Spring semester (January-March): master the inference framework
Units 6-9 introduce hypothesis testing and confidence intervals for proportions, means, chi-square, and slope. For every inference procedure, learn the four-step structure: state (name the test and hypotheses), plan (check conditions), do (compute), conclude (interpret in context). College Board grades FRQs on all four steps. Students who skip the state and plan steps lose points even when their computation is correct.
Final 6 weeks (April-early May): timed FRQ practice with official rubrics
Complete at least 2 full past exam FRQ sets under timed conditions (90 minutes for Section II). After each practice session, score your responses against the published scoring guidelines at AP Central. Count each time you wrote an interpretation without all three required elements: the direction, the magnitude, and the real-world context. That count is your improvement target for the next practice session.
Should You Take AP Stats If You Are Not a Math Person?
AP Statistics may be the most genuinely accessible AP math course for students who struggle with abstract algebra. The reason is in what the exam actually tests. There are no algebraic manipulations longer than a few steps. There are no abstract proofs. The graphing calculator handles most numerical computation. What AP Statistics tests is statistical reasoning: understanding what a p-value tells you, recognizing when a sample is biased, evaluating whether a study's design supports its conclusion.
That reasoning can be learned without a strong traditional math background. Students who read carefully, think logically, and write clearly have the foundation AP Statistics requires. Students who freeze when they see a formula but can explain in a sentence why a convenience sample might skew results are closer to a 5 than they think.
The normal distribution above illustrates the 68-95-99.7 rule, also called the empirical rule. AP Statistics students use this rule throughout Units 4, 5, and the inference units to determine how unusual a sample statistic is and whether it provides enough evidence to reject a null hypothesis. This is the kind of reasoning AP Statistics tests: not symbolic manipulation, but understanding what a distribution tells you about probability.
AP Statistics requires less computation than AP Calculus AB but more writing than any other AP math course. Students who read the sibling breakdowns of AP Calculus AB difficulty and AP English Language difficulty often find that AP Statistics sits conceptually between them: more structured than an English course, less abstract than calculus.
How to Know If You Are Ready for AP Statistics
AP Statistics has no formal prerequisites beyond Algebra 2, but students who enter the course without certain habits in place spend the first semester catching up. Use the checklist below to assess readiness before junior or senior year.
You can read a data table and make an observation about its pattern
AP Statistics FRQs begin by presenting a dataset or summary statistics and asking what you notice. Students who struggle to describe trends in a table spend their FRQ time processing the data rather than analyzing it. If you can look at a two-way frequency table and immediately identify which row or column has the highest proportion, you have the baseline reading skill the course requires.
You can write a sentence that explains why something is true, not just that it is true
The interpret-in-context requirement runs throughout AP Statistics. A sentence that says "the mean is 4.2" earns no points. A sentence that says "the mean number of hours students study per week is 4.2 in this sample" earns the interpretation credit. If you habitually include the what and the why in your written answers, you are closer to a 5 than most students who enter the course.
You are comfortable using a graphing calculator for basic computations
AP Statistics requires a graphing calculator for the exam. Students who have never used a TI-84 or equivalent should spend 2-3 hours before the course begins learning to compute 1-variable statistics, create histograms, and run basic regression. Calculator familiarity saves time on the FRQ section and prevents arithmetic errors on inference calculations.
You are willing to check your work against specific rubric criteria, not just gut feel
Improving in AP Statistics requires grading your own FRQ practice against the official rubric point by point, not just reading your answer and thinking it seems right. Students who practice this self-assessment habit from October onward close the interpretation gap faster than students who wait until April to look at scoring guidelines.
Where Does Your Practice Score Put You?
If you want to see where your current AP Statistics preparation maps on the actual 5-point scale, use Classeva's AP Score Predictor. Enter your practice FRQ scores and multiple-choice percentage to project your likely composite band. A separate AP Credit Savings Calculator shows the tuition value of a 4 or 5 at specific colleges, which is worth checking before you decide how much preparation effort the exam warrants.
AP Score Predictor
Enter your AP Statistics practice scores to see your projected score band and identify which section to prioritize in your remaining study time.
For a full archive of AP Statistics past FRQs with scoring guidelines, visit the AP Statistics resources hub. Students comparing their math AP options across subjects may also find useful context in our breakdowns of AP Calculus AB difficulty and APUSH difficulty. College Board publishes the full exam format and past free-response questions at AP Central's AP Statistics exam page.
Key Takeaways
- AP Statistics is moderately difficult. A ~16% 5-rate and ~60% pass rate place it in the middle of the AP difficulty spectrum, above AP Physics 1 in accessibility and broadly comparable to AP English Language. [VERIFY: 2025 College Board data]
- There is no calculus in AP Statistics. Derivatives, integrals, and limits do not appear. The math is arithmetic and algebra, with the graphing calculator handling all numerical heavy lifting. What is hard is the reasoning and writing, not the computation.
- Writing in context is the skill that separates scores. Every inference conclusion must include the direction of the finding, the magnitude (p-value or interval), and a sentence tying the result to the specific real-world scenario in the problem. Students who omit the contextual sentence lose points even when their computation is correct.
- Inference accounts for roughly 35-45% of the exam. Units 6-9 are the highest-weighted domain. Students who master the four-step inference procedure (state, plan, do, conclude) for proportions and means have addressed the largest single slice of exam content.
- AP Statistics suits non-STEM students better than AP Calculus AB in most cases. Social science, business, health, and humanities majors use statistics directly in their college coursework and careers. A score of 4 or 5 frequently exempts students from a required college statistics course, saving real tuition dollars.
- A graphing calculator is required and should be mastered before the exam. TI-84 or equivalent. Practice computing test statistics, regression output, and probability values on the calculator during the school year, not for the first time in the exam room.
- The investigative task requires time management. Read all parts before answering any. The 25-minute allocation goes fast, and the parts are connected. Students who answer Part A without understanding what Part C asks often contradict themselves halfway through.
Frequently Asked Questions
What percentage of students get a 5 on AP Statistics?
Approximately 15-17% of AP Statistics test-takers earn a 5 in a typical year, based on College Board score distribution data. [VERIFY: 2025 College Board AP Score Distributions at reports.collegeboard.org] The pass rate (scores 3-5) hovers around 58-62%. That places AP Statistics in the moderate range of AP difficulty, comparable to AP Biology and AP English Language.
Is AP Statistics harder than AP Calculus AB?
AP Statistics and AP Calculus AB are comparable in difficulty but test completely different skills. AP Calculus AB demands procedural fluency with derivatives, integrals, and limits. AP Statistics has no calculus at all, but requires precise statistical reasoning and the ability to write correct interpretations in context. Students who struggle with abstract algebra often find AP Statistics more accessible. Students who find writing analytical explanations difficult tend to underperform in AP Statistics despite having strong arithmetic skills.
Do I need a graphing calculator for AP Statistics?
Yes. A graphing calculator is required for the AP Statistics exam. College Board permits most standard graphing calculators including the TI-84 Plus CE, TI-Nspire CX, and Casio fx-9750GIII. The calculator computes normal probabilities, t-statistics, chi-square values, regression equations, and summary statistics. Students who do not have a graphing calculator at home should confirm their school provides exam-day loaners.
Can I self-study AP Statistics?
Yes. AP Statistics is one of the more self-studyable AP exams because the content does not require a teacher for physical lab demonstrations or long prerequisite chains. College Board publishes the full Course and Exam Description (CED), past FRQs, and scoring guidelines at no cost. The main challenge in self-study is practicing the interpret-in-context skill with self-grading against the official rubric, since that is where most self-studiers underestimate the bar.
Is AP Statistics a good choice if I am not planning to study math or science?
AP Statistics is an excellent choice for non-STEM majors. Statistics underlies research methods in psychology, sociology, political science, economics, and public health, so many non-STEM college majors require at least one statistics course. A score of 4 or 5 on AP Statistics frequently exempts students from that college requirement, saving a semester of tuition.
Does AP Statistics count for math credit in college?
It depends on the college and major. Most universities award credit for AP Statistics scores of 4 or 5, typically toward an introductory statistics requirement. However, STEM programs (engineering, computer science, physics) often require calculus-based statistics, and AP Statistics may not satisfy those specific requirements. Always check each college's AP credit policy directly before assuming a given score earns the credit you need.
What is the investigative task in AP Statistics?
The investigative task is the sixth free-response question on the AP Statistics exam (Part B of Section II). It carries more weight than the five standard multi-part FRQs and asks students to synthesize statistical concepts across several connected parts. The task often involves designing a study, analyzing data, drawing inferences, and justifying conclusions in context. Students have approximately 25 minutes for the investigative task.
How many units are in AP Statistics?
AP Statistics has 9 units as defined in the College Board Course and Exam Description (CED). The units cover: exploring one-variable data, exploring two-variable data, collecting data (sampling and experimentation), probability and random variables, sampling distributions, and four inference units covering proportions, means, chi-square tests, and inference for slope. Inference units together typically account for 35-45% of the exam. [VERIFY: current CED at apcentral.collegeboard.org/courses/ap-statistics]
Score data sourced from College Board AP Score Distributions (approximate 2025 figures; verify at reports.collegeboard.org). Exam structure from the AP Statistics Exam page on AP Central. Unit weights from the College Board AP Statistics course page. [VERIFY all figures against the July 2025 College Board annual score report.]