AP Biology Unit 5: Heredity Topics That Show Up Every Year
Tracing Unit 5 through five years of released AP Biology free-response questions, one pattern stands out: the genetics FRQ almost always involves either a dihybrid cross with ratio analysis or a three-generation pedigree requiring you to determine the inheritance pattern. Students who memorize Mendel's laws as definitions tend to miss those questions. Students who practice solving crosses under time pressure rarely do.
What Does AP Biology Unit 5 Cover?
Unit 5 spans the mechanisms of heredity from the cellular level (meiosis) through the population level (chromosomal disorders). The AP Biology Course and Exam Description (CED) organizes the unit into five topic clusters: meiosis and genetic diversity, Mendelian genetics, non-Mendelian genetics, environmental effects on phenotype, and chromosomal inheritance.
Unit 5 Exam Weight and Topic Breakdown
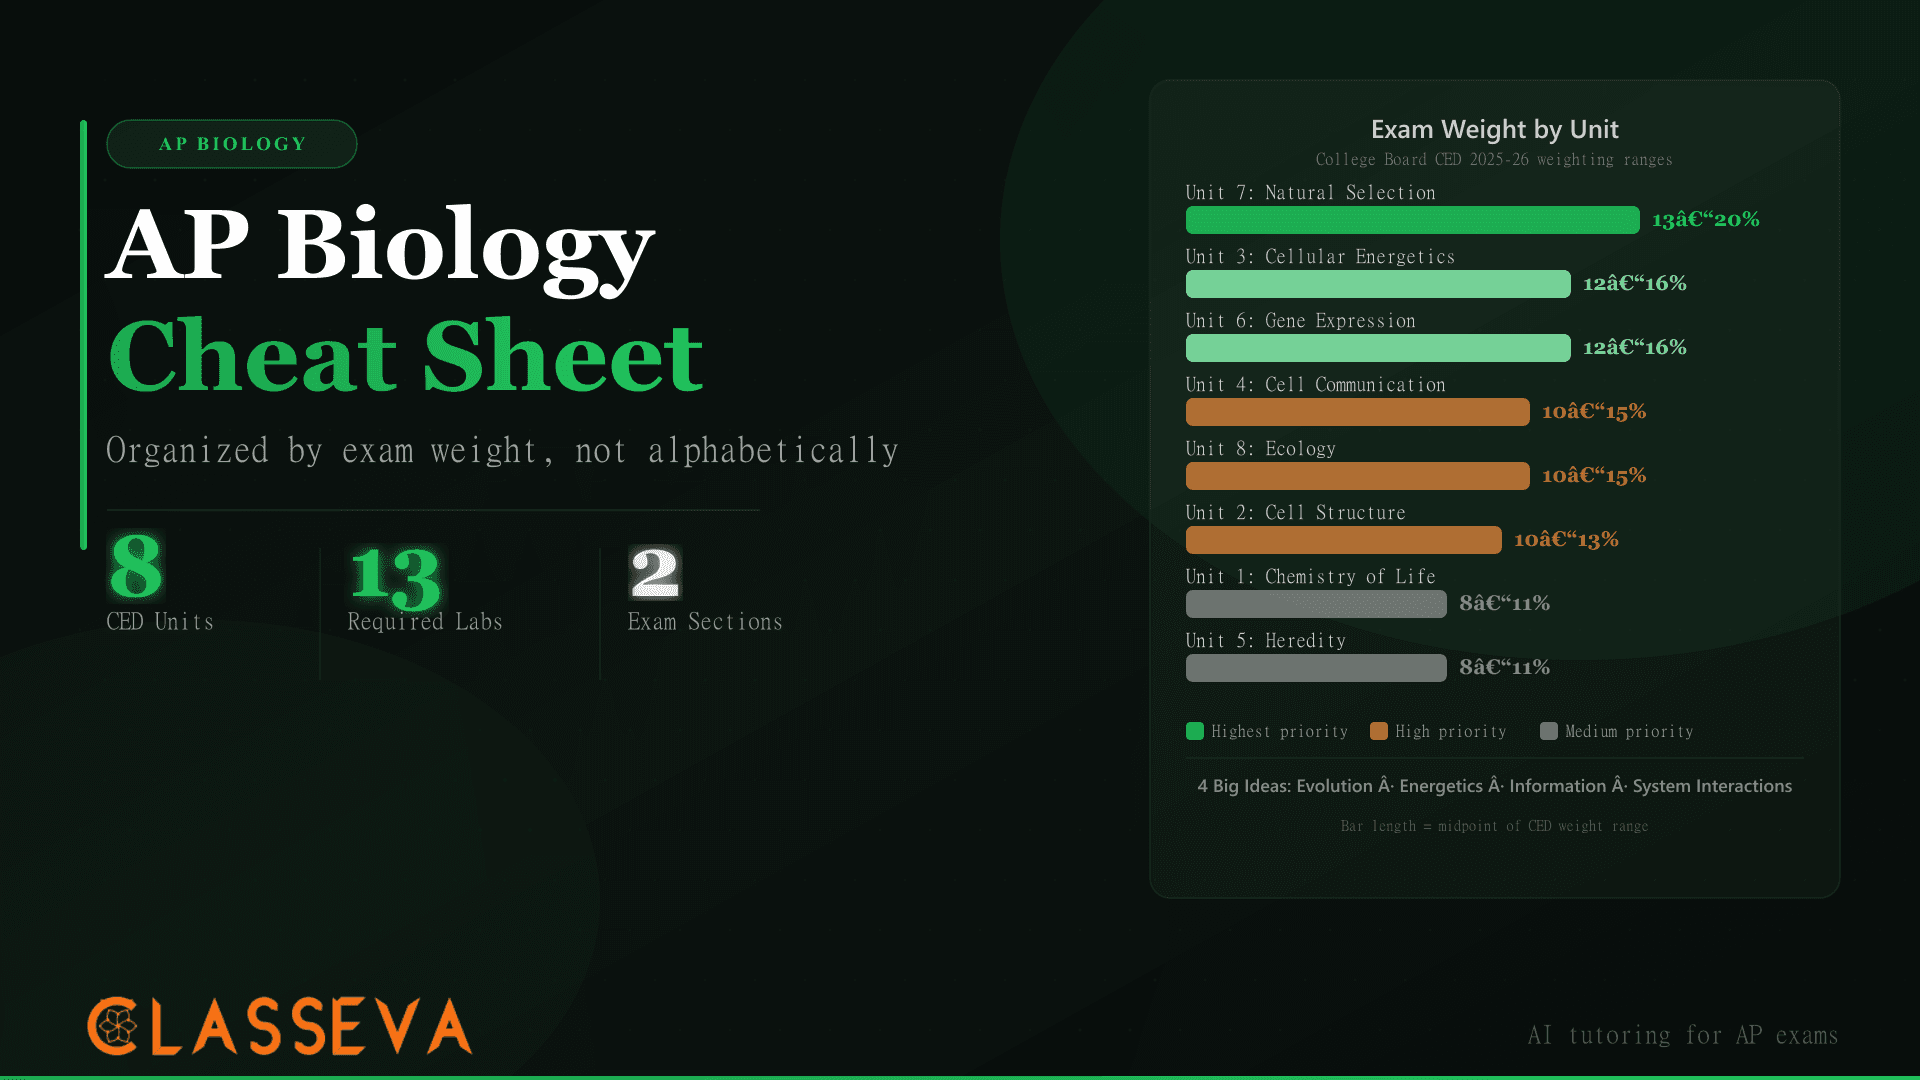
Unit 5 carries 8-11% of the AP Biology exam, which places it at the lower end of the eight units by weight. But that percentage understates its actual exam presence. Punnett square mechanics and chi-square analysis appear in questions officially tagged to other units, and FRQ scoring rubrics for genetics problems tend to reward precise procedural work over broad conceptual knowledge.
| Unit | Topic | Exam Weight |
|---|---|---|
| 1 | Chemistry of Life | 8–11% |
| 2 | Cell Structure and Function | 10–13% |
| 3 | Cellular Energetics | 12–16% |
| 4 | Cell Communication and Cell Cycle | 10–15% |
| 5 | Heredity | 8–11% |
| 6 | Gene Expression and Regulation | 12–16% |
| 7 | Natural Selection and Evolution | 13–20% |
| 8 | Ecology | 10–15% |
Source: College Board AP Biology Course and Exam Description (CED)
Unit 7 (Natural Selection) carries the single heaviest weight at 13-20%. Units 3 and 6 follow at 12-16% each. If your study time is limited, allocate hours proportionally to these weights and treat Unit 5 as a precision skill set rather than a memorization block.
How Is Meiosis Different from Mitosis?
Meiosis produces four genetically unique haploid cells (n) from one diploid parent cell (2n) through two sequential divisions. Mitosis produces two genetically identical diploid cells (2n) from one diploid parent through a single division. The AP exam expects you to compare these processes directly, including the specific stages where chromosome number changes and where genetic variation enters.
Where the Chromosome Count Changes
In mitosis, chromosome number stays constant: every daughter cell receives the same number as the parent cell. In meiosis, Meiosis I is the reductive division. Homologous chromosome pairs separate during Meiosis I, halving the chromosome number. Meiosis II then separates sister chromatids, producing four cells, each with the haploid number. Crossing over during prophase I (when homologs pair up and exchange segments) generates genetic variation before the divisions even begin.
The CED explicitly connects Unit 5 meiosis content back to Unit 4's mitosis coverage. Students who reviewed the AP Biology Unit 4 guide (cell communication and cell cycle) recently will recognize that the G1, S, and G2 phases of interphase precede meiosis just as they precede mitosis. The key difference: DNA replication in the S phase before meiosis is followed by two divisions rather than one.
How Do You Solve a Mendelian Genetics Problem?
Mendelian genetics problems on the AP exam follow a predictable structure: you receive parent genotypes (or phenotypes), then must predict offspring genotype and phenotype ratios. The Law of Segregation governs monohybrid crosses (one gene, two alleles). The Law of Independent Assortment governs dihybrid crosses (two genes on different chromosomes, each assorting independently).
Monohybrid Crosses: The 3:1 Ratio
A monohybrid cross tracks inheritance of a single gene with two alleles. The classic example: two heterozygous tall pea plants (Tt × Tt). The cross produces three genotypes (TT, Tt, tt) in a 1:2:1 ratio and two phenotypes (Tall and Short) in a 3:1 ratio.
Write the parent genotypes
Tall (heterozygous): Tt. Both parents are Tt. Each parent produces two types of gametes: T and t in equal proportions (1/2 each).
Set up the 2×2 Punnett square
Place T and t across the top (parent 1 gametes) and T and t down the left side (parent 2 gametes). Fill in four cells: TT (top-left), Tt (top-right), Tt (bottom-left), tt (bottom-right).
Read the genotypic ratio
1 TT : 2 Tt : 1 tt. One in four offspring is homozygous dominant, two are heterozygous (carriers of the recessive allele), and one is homozygous recessive.
Read the phenotypic ratio
3 Tall : 1 Short. TT and both Tt offspring express the dominant phenotype (Tall). Only tt offspring express the recessive phenotype (Short). This 3:1 ratio is Mendel's signature result.
Verify your work
All four cells in the Punnett square should be filled. Genotype fractions must sum to 1 (1/4 + 2/4 + 1/4 = 4/4). Phenotype fractions must sum to 1 (3/4 + 1/4 = 4/4).
Dihybrid Crosses: The 9:3:3:1 Ratio
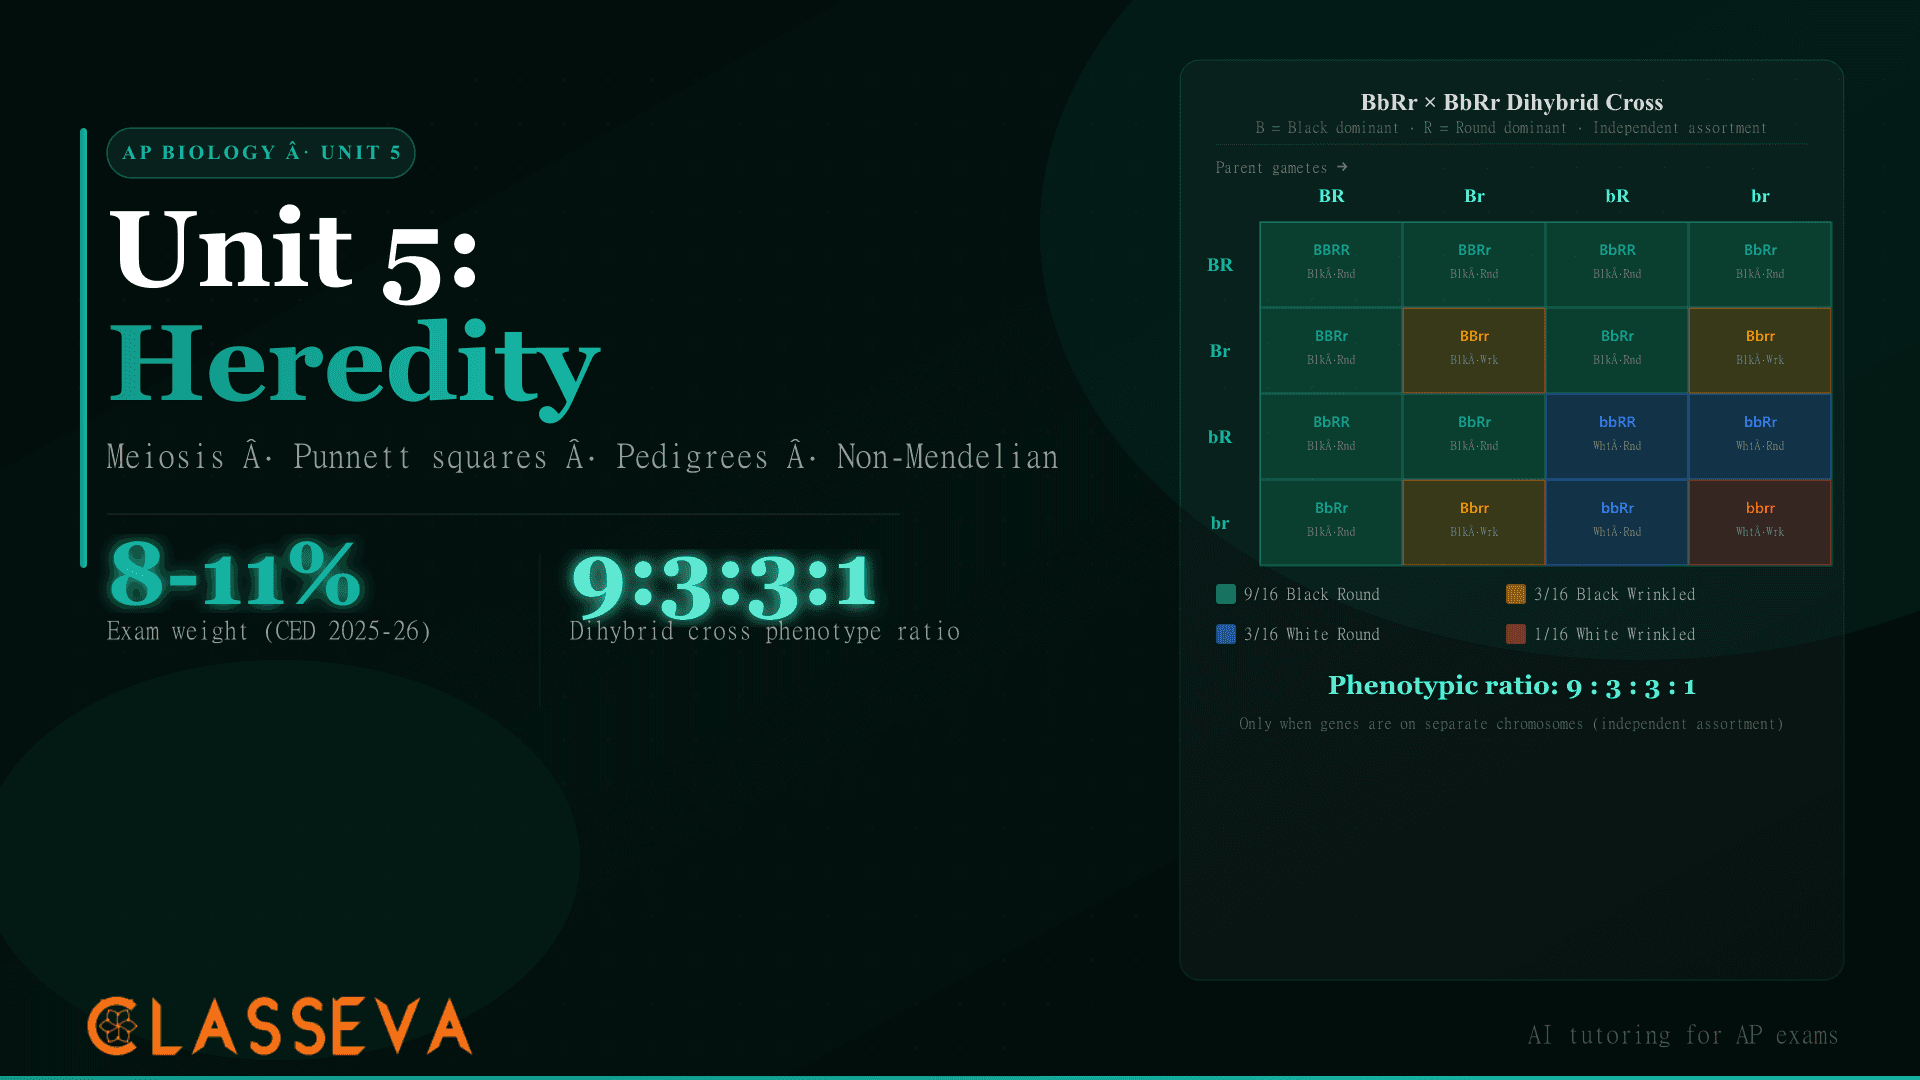
Dihybrid crosses track two independently assorting genes simultaneously. When both parents are heterozygous for both genes (BbRr × BbRr), the offspring produce four phenotypic classes in a 9:3:3:1 ratio. This ratio only emerges when both genes sit on separate chromosomes and assort independently; linked genes produce different ratios.
The worked example below uses seed color (B = Black dominant over b = White) and seed shape (R = Round dominant over r = Wrinkled) in pea plants. Each BbRr parent produces four gamete types: BR, Br, bR, br, each at 1/4 frequency. The 4×4 Punnett square holds 16 equally likely cells.
You do not need to fill all 16 cells on an exam. Use the multiplication rule: probability of Black (3/4) × probability of Round (3/4) = 9/16 Black Round. Each phenotype class follows from this same logic.
What Is Non-Mendelian Inheritance?
Non-Mendelian inheritance describes any pattern where the simple 3:1 or 9:3:3:1 ratios break down. The AP Biology CED covers five major departures from Mendel's model: incomplete dominance, codominance, multiple alleles, polygenic inheritance, and pleiotropy.
Incomplete Dominance vs Codominance
In incomplete dominance, neither allele fully masks the other. A red-flowered plant (R1R1) crossed with a white-flowered plant (R2R2) produces pink F1 offspring (R1R2). The pink phenotype is intermediate because neither R1 nor R2 dominates. The 2:1 phenotypic shorthand breaks down here: F2 offspring from two pink parents produce red : pink : white in a 1:2:1 ratio, not 3:1.
Codominance differs in one specific way: both alleles show their full phenotype simultaneously. ABO blood typing demonstrates this. A person with genotype IAIB produces both A and B antigens on red blood cells. Neither antigen is blended or reduced. The phenotype is Type AB, not an intermediate between A and B. On the AP exam, distinguishing these two patterns comes down to the heterozygote: does it blend (incomplete dominance) or show both fully (codominance)?
Polygenic Inheritance and Pleiotropy
Polygenic inheritance occurs when multiple genes collectively determine one phenotype. Human skin color results from at least three to four interacting genes, each contributing additive effects. The result is a continuous distribution of phenotypes rather than discrete classes. The AP exam tests polygenic inheritance by asking you to recognize continuous bell-curve distributions of phenotypic data as evidence that multiple genes are involved.
Pleiotropy flips the relationship: one gene, multiple phenotypes. Sickle cell anemia results from a single nucleotide change in the hemoglobin gene, yet affects red blood cell shape, oxygen-carrying capacity, organ blood flow, pain episodes, and (in heterozygotes) resistance to malaria. The CED uses pleiotropy to illustrate why genetic diseases often present with seemingly unrelated organ systems affected. For a broader look at the genetics concepts tested across the full exam, the AP Biology visual reference guide covers these patterns organized by exam weight.
How Do You Read a Pedigree on the AP Exam?
A pedigree chart traces a trait through multiple generations of a family. AP Biology pedigree questions ask you to (1) identify the inheritance pattern from the chart alone, (2) determine genotypes of specific individuals, and (3) calculate the probability that an offspring inherits the trait. These questions appear in both the MCQ section and as full FRQ problems with multiple parts.
Pedigree Symbols and Inheritance Patterns
Squares represent males. Circles represent females. Filled symbols indicate affected individuals (expressing the trait). A horizontal line connecting two symbols indicates a mating pair. Vertical and horizontal lines below a mating pair connect to their offspring. In X-linked carrier conventions used for the pedigree below, half-filled circles indicate carrier females who carry one copy of the X-linked recessive allele but do not express the trait.
Before assigning genotypes, determine whether the trait appears autosomal or X-linked, and dominant or recessive. Four signals narrow the inheritance pattern: whether both sexes are affected equally, whether affected individuals always have affected parents, whether unaffected parents produce affected children, and the transmission pattern from generation to generation.
Tracing an X-Linked Recessive Trait
X-linked recessive traits affect males far more often than females. Males carry only one X chromosome (X Y), so a single recessive allele on that X produces the phenotype. Females need two copies (X^a X^a) to be affected. Carrier females (X^A X^a) appear unaffected but can pass the allele to half their sons.
Identify the pattern: more affected males than females
In the pedigree below, affected individuals are male (filled squares). The carrier females are unaffected but produce affected sons. This male-biased pattern is the primary signal for X-linked inheritance.
Confirm recessive: unaffected parents have affected children
Generation I: carrier female (half-filled circle) × normal male. Their son (Generation II) is affected despite both parents appearing normal. This confirms recessive. If the trait were dominant, at least one parent would be affected.
Assign genotypes using X-linked notation
Generation I female: X^A X^a (carrier). Generation I male: X^A Y (unaffected). Affected Generation II son: X^a Y. Carrier Generation II daughter: X^A X^a (proven by having an affected son in Generation III).
Calculate offspring probabilities
Carrier female (X^A X^a) × normal male (X^A Y) produces: 1/4 normal female (X^A X^A), 1/4 carrier female (X^A X^a), 1/4 normal male (X^A Y), 1/4 affected male (X^a Y). Each son faces a 50% chance of being affected.
What Happens When Chromosomes Fail to Separate?
Nondisjunction occurs when homologous chromosomes (in Meiosis I) or sister chromatids (in Meiosis II) fail to separate during cell division. The result: some gametes carry an extra chromosome, while others are missing one. When these abnormal gametes fuse with normal gametes during fertilization, the zygote has an incorrect chromosome number, called aneuploidy.
Trisomy 21 (Down syndrome) is the most commonly tested example: three copies of chromosome 21 instead of two, typically from nondisjunction during Meiosis I in the egg. The AP exam also tests the conceptual difference between Meiosis I and Meiosis II nondisjunction outcomes. Meiosis I nondisjunction sends both homologs to one cell, producing two different abnormal gametes (n+1 and n-1) and potentially two normal gametes from the other division. Meiosis II nondisjunction separates sister chromatids unequally, producing two copies of the same chromosome in one gamete.
If the question shows two identical extra chromosomes in the affected offspring, the error was in Meiosis II (sister chromatids failed to separate). If it shows one extra chromosome of each homolog, the error was in Meiosis I. This distinction appears on FRQs and in multi-part MCQ sets.
Which Unit 5 Concepts Appear Most on the AP Exam?
Looking across the released AP Biology FRQs from 2019 through 2025, genetics problems cluster around three skill sets. Dihybrid cross analysis (including the chi-square test for goodness of fit) appears almost every year. Pedigree interpretation with X-linked recessive patterns appears roughly every other year. Non-Mendelian inheritance (especially codominance in ABO blood typing and incomplete dominance) appears frequently in the MCQ section.
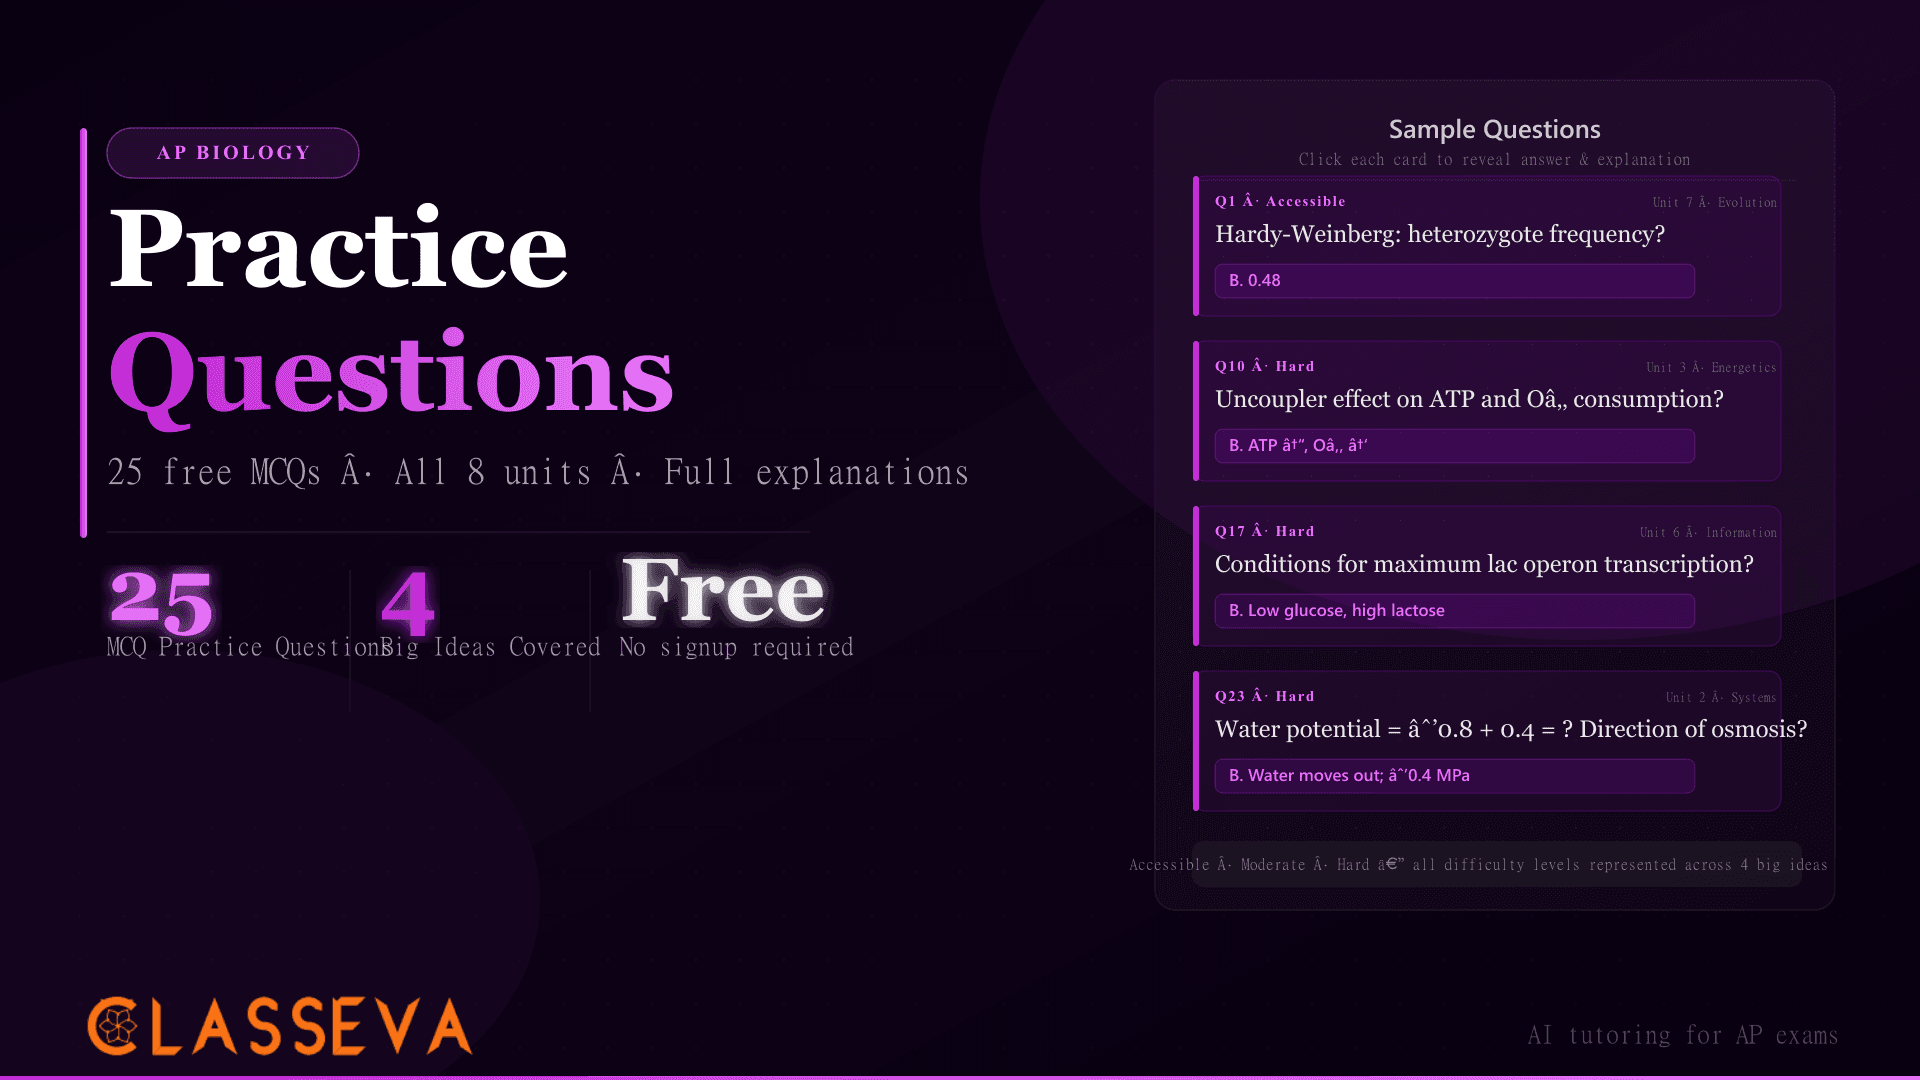
The chi-square test connects Unit 5 to the science practice skills the CED emphasizes throughout. You are given observed offspring ratios (from an actual cross), a null hypothesis (the expected Mendelian ratio), and asked to calculate a chi-square value and interpret it. A chi-square value below the critical value (typically 3.84 for one degree of freedom at p=0.05) means the observed data fits the expected ratio. A value above it means the results are statistically unlikely under that model. For AP Biology practice questions with worked genetics problems, see the AP Biology practice question set with full explanations.
| Skill | Frequency in Released FRQs | Typical Format |
|---|---|---|
| Dihybrid cross + chi-square | Nearly every year | Long FRQ, multiple parts |
| Pedigree analysis | Every 1-2 years | Short FRQ or multi-part MCQ |
| Codominance / incomplete dominance | Most years in MCQ | Discrete MCQ, 1-2 questions |
| Meiosis vs mitosis comparison | Every 1-2 years | Short FRQ or MCQ set |
| Nondisjunction / aneuploidy | Every 2-3 years | Short FRQ or MCQ |
Based on College Board released AP Biology FRQs 2019–2025
For the broader context of how Unit 5 fits into the full exam alongside the higher-weighted units, the AP Biology difficulty breakdown covers exactly where students lose the most points and which study hours produce the highest return. The AP Biology resources hub links to every released FRQ from the past five years organized by unit.
Estimate Your AP Biology Score
Use the AP Score Predictor below to convert your Unit 5 practice performance into an estimated AP Biology score. Enter your correct answers across all units to see where your current trajectory lands. The predictor uses the College Board's published score distributions and composite scoring thresholds to give you a data-grounded estimate. For context on what each score earns in college credit, the AP Biology score distribution analysis covers which scores earn credit at most universities.
AP Biology Score Predictor
Enter your practice scores across all 8 units to estimate your AP Biology exam score.
Key Takeaways
- Unit 5 (Heredity) carries 8-11% of the AP Biology exam, tied with Unit 1 as the lowest-weighted unit, but the procedural skills it tests appear across other units' questions too.
- Meiosis produces 4 genetically unique haploid cells through two sequential divisions; mitosis produces 2 identical diploid cells through one division. Crossing over during Meiosis I generates genetic variation before division begins.
- Monohybrid crosses (Tt × Tt) produce a 3:1 phenotypic ratio and 1:2:1 genotypic ratio. Dihybrid crosses (BbRr × BbRr) produce a 9:3:3:1 phenotypic ratio across four classes.
- Non-Mendelian inheritance patterns break simple Mendelian ratios: incomplete dominance produces intermediate heterozygotes, codominance expresses both alleles fully, and polygenic traits follow a continuous bell-curve distribution.
- X-linked recessive traits appear in more males than females because males carry only one X chromosome. Carrier females appear unaffected but pass the allele to half their sons.
- Nondisjunction during Meiosis I sends both homologs to one cell; during Meiosis II, sister chromatids fail to separate. Both produce aneuploid gametes, but the resulting chromosome combinations differ.
- The chi-square goodness-of-fit test appears on AP Biology FRQs almost every year, typically paired with genetics cross data. Practice interpreting whether chi-square values fall above or below the p=0.05 critical value.
AP Biology Unit 5 content sourced from the AP Biology Course and Exam Description published by College Board. Exam weight percentages from the AP Students College Board unit overview. Released FRQ data from the AP Central past exam questions archive. Related reading: AP Biology practice questions, difficulty and score distribution breakdown, and the AP Biology visual reference guide.